Add a Feature
Breathe Free
Breathe Free
Mobile app | UX Research & Design | 4 weeks
Mobile app | UX Research & Design | 4 weeks
Overview
Overview
Background
Background
As of early 2025, asthma affects 29 million Americans, with adult cases up 14.3% since 2021.
Problem
Problem
Asthma management is often reactive, leaving individuals vulnerable to sudden flare-ups and environmental triggers. Many struggle to track symptoms, identify patterns, and anticipate risks, leading to increased stress and preventable health complications. Without real-time insights or proactive support, users are left managing their condition without the tools to stay ahead of potential issues.
Key Objective
Improve Asthma Management: Help users actively monitor and manage their asthma with real-time data and personalized insights.
Reduce Asthma Attacks: Decrease the frequency of asthma attacks by 20% within the first year of app use.
Provide Early Warnings: Ensure 90% of users receive timely alerts about potential triggers, such as poor air quality and high pollen counts.
Process
Process
Research
Research Goals
Understand user behavior & pain points.
Evaluate the impact of real-time air quality insights.
Assess user adoption & trust in AI-powered predictions.
Define key features & design expectations.
Competitive Analysis

Interview Insights
I don’t always remember to check air quality, but if I got a notification telling me the air was bad today, I’d definitely pay attention.
– Participant from Ukraine
I don’t have time to research what air quality levels mean. Just tell me if it’s safe to take my kids to the park. – Participant from Seattle
Research
Research Goals
Understand user behavior & pain points.
Evaluate the impact of real-time air quality insights.
Assess user adoption & trust in AI-powered predictions.
Define key features & design expectations.
Competitive Analysis
Interview Insights
I don’t always remember to check air quality, but if I got a notification telling me the air was bad today, I’d definitely pay attention. – Participant from Minnesota
I don’t have time to research what air quality levels mean. Just tell me if it’s safe to take my kids to the park.
– Participant from Florida
Key Findings
Users struggle to find and interpret real-time air quality data in a way that helps them take action.
People with asthma, allergies, or respiratory concerns need a more accessible and user-friendly solution.
Clear, personalized warnings and recommendations are essential for managing air quality risks effectively.
Simplicity and ease of use are critical for adoption and daily engagement.
Process
Research
Define
Design
Test
Iterate
Define
Research
Research Goals
Understand user behavior & pain points.
Evaluate the impact of real-time air quality insights.
Assess user adoption & trust in AI-powered predictions.
Define key features & design expectations.
Competitive Analysis
Interview Insights
I don’t always remember to check air quality, but if I got a notification telling me the air was bad today, I’d definitely pay attention. – Participant from Minnesota
I don’t have time to research what air quality levels mean. Just tell me if it’s safe to take my kids to the park.
– Participant from Florida
Key Findings
Users struggle to find and interpret real-time air quality data in a way that helps them take action.
People with asthma, allergies, or respiratory concerns need a more accessible and user-friendly solution.
Clear, personalized warnings and recommendations are essential for managing air quality risks effectively.
Simplicity and ease of use are critical for adoption and daily engagement.
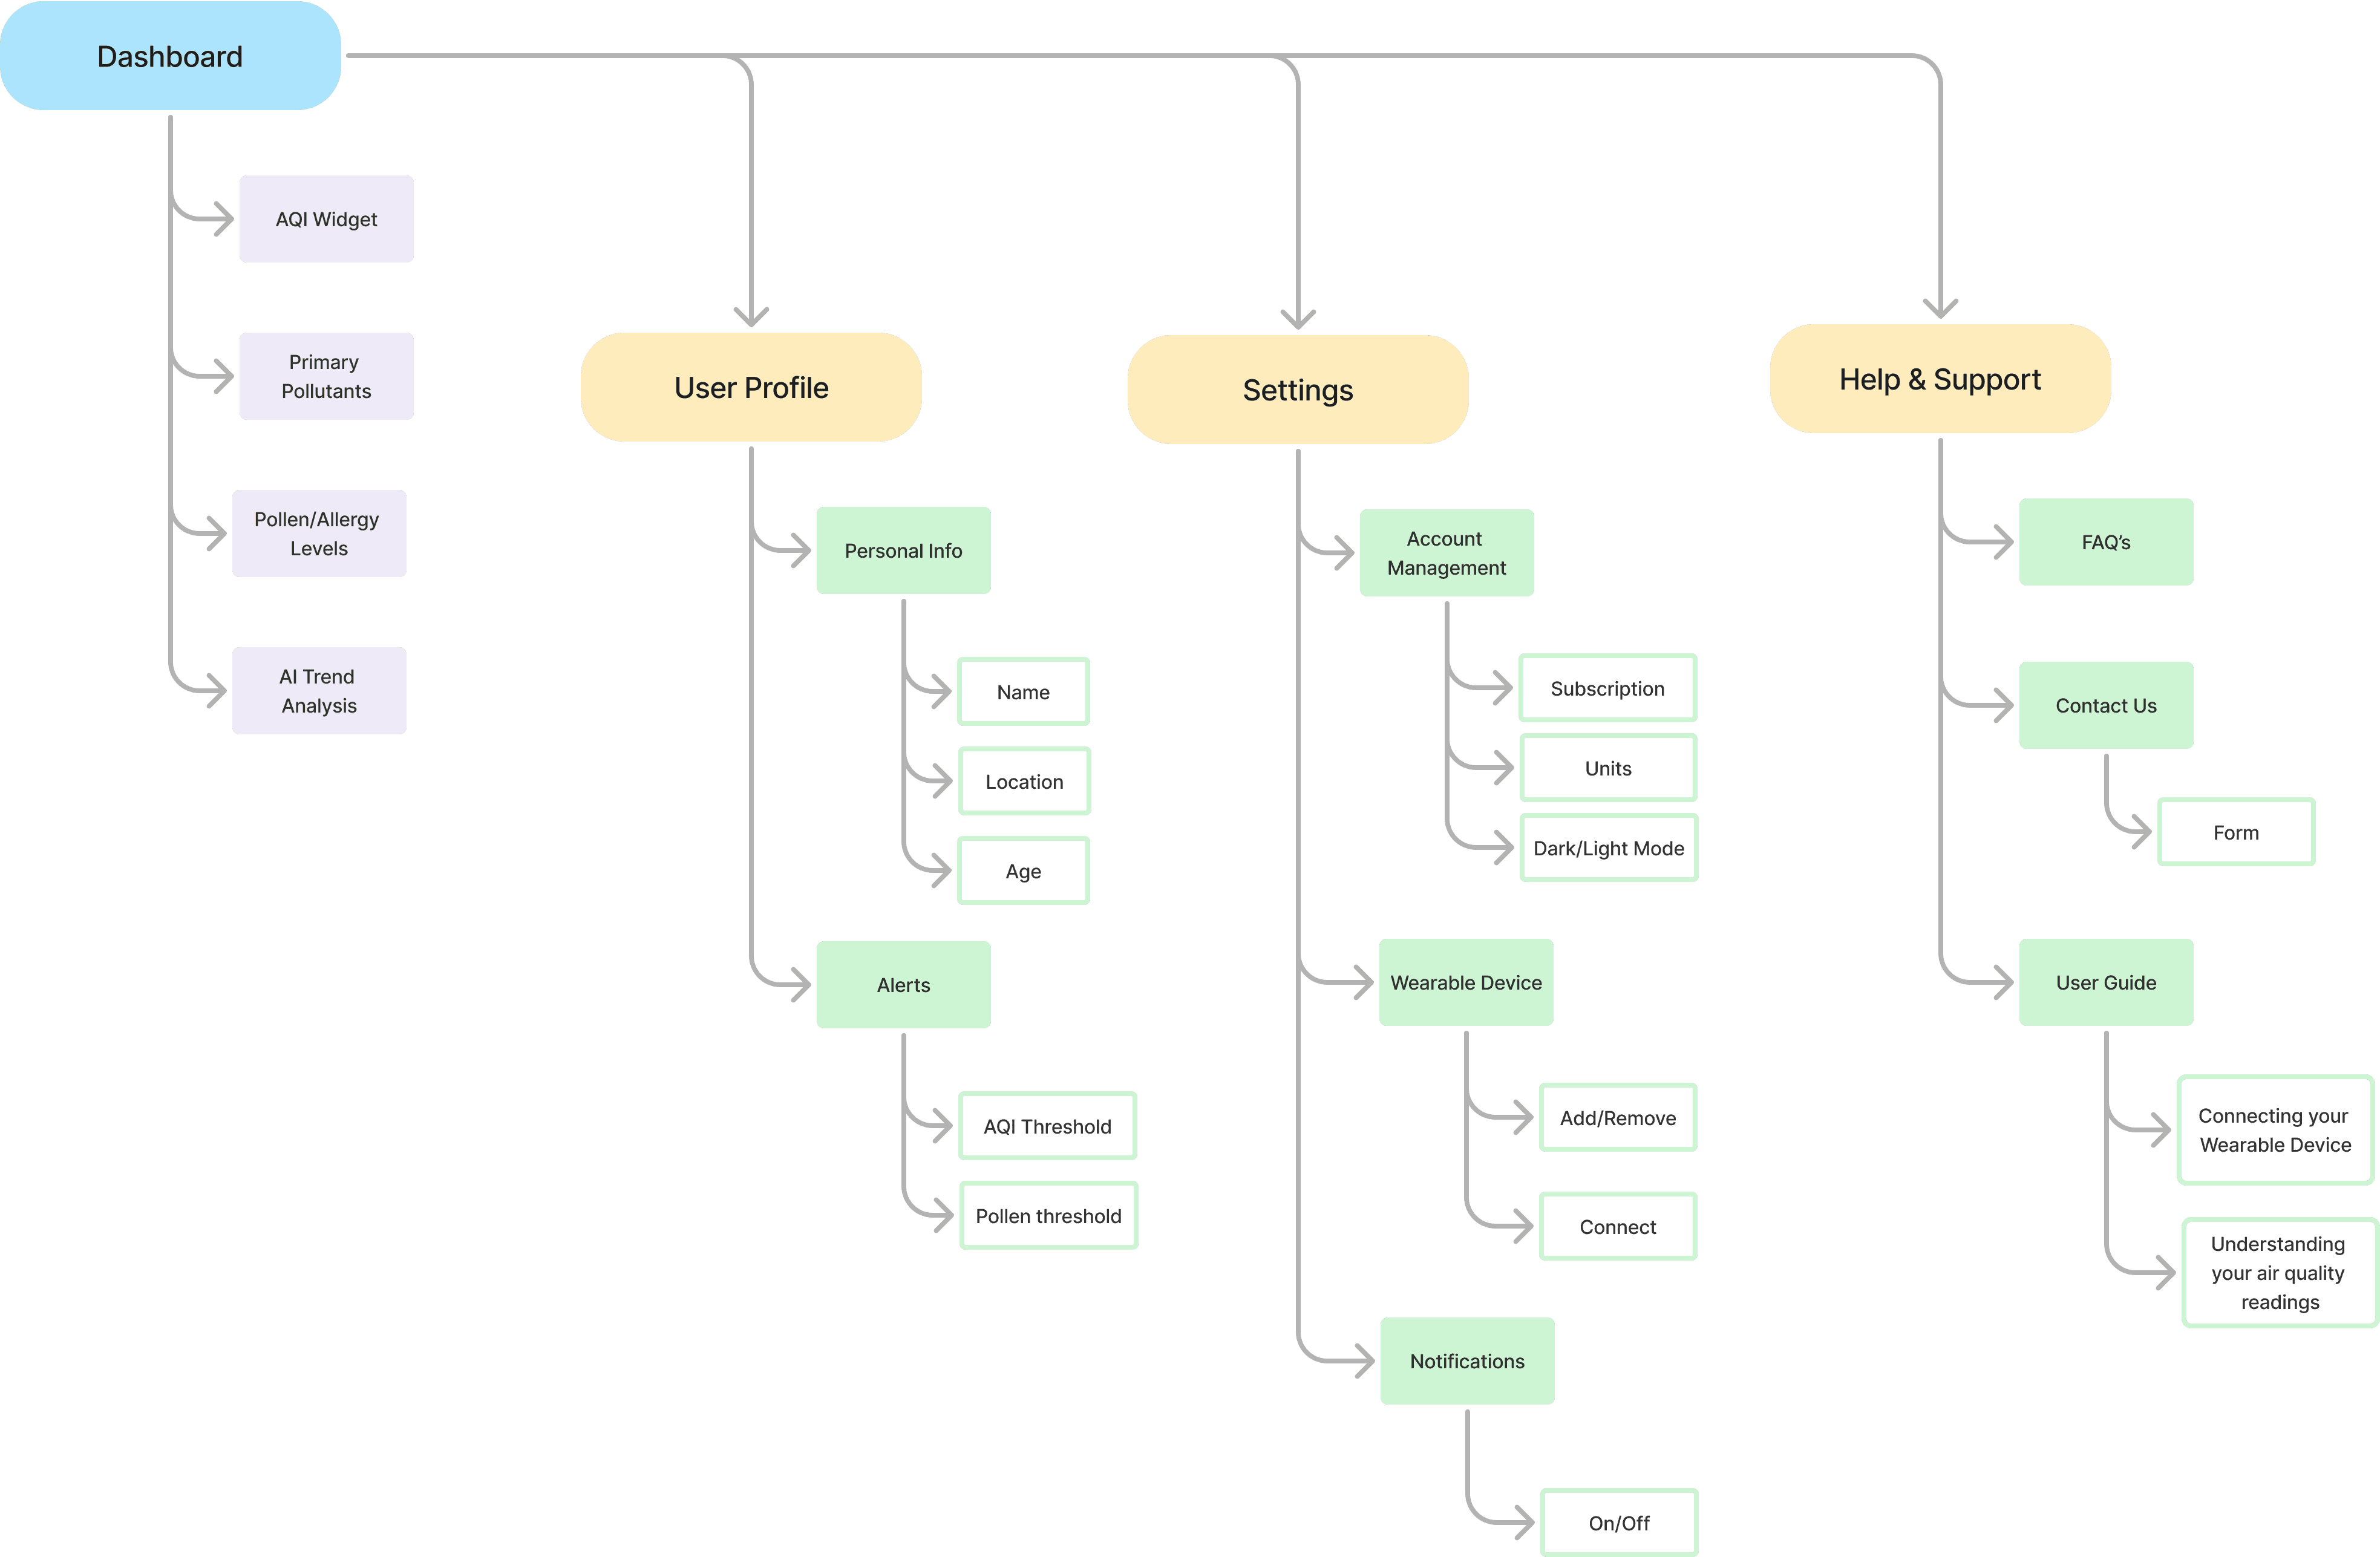
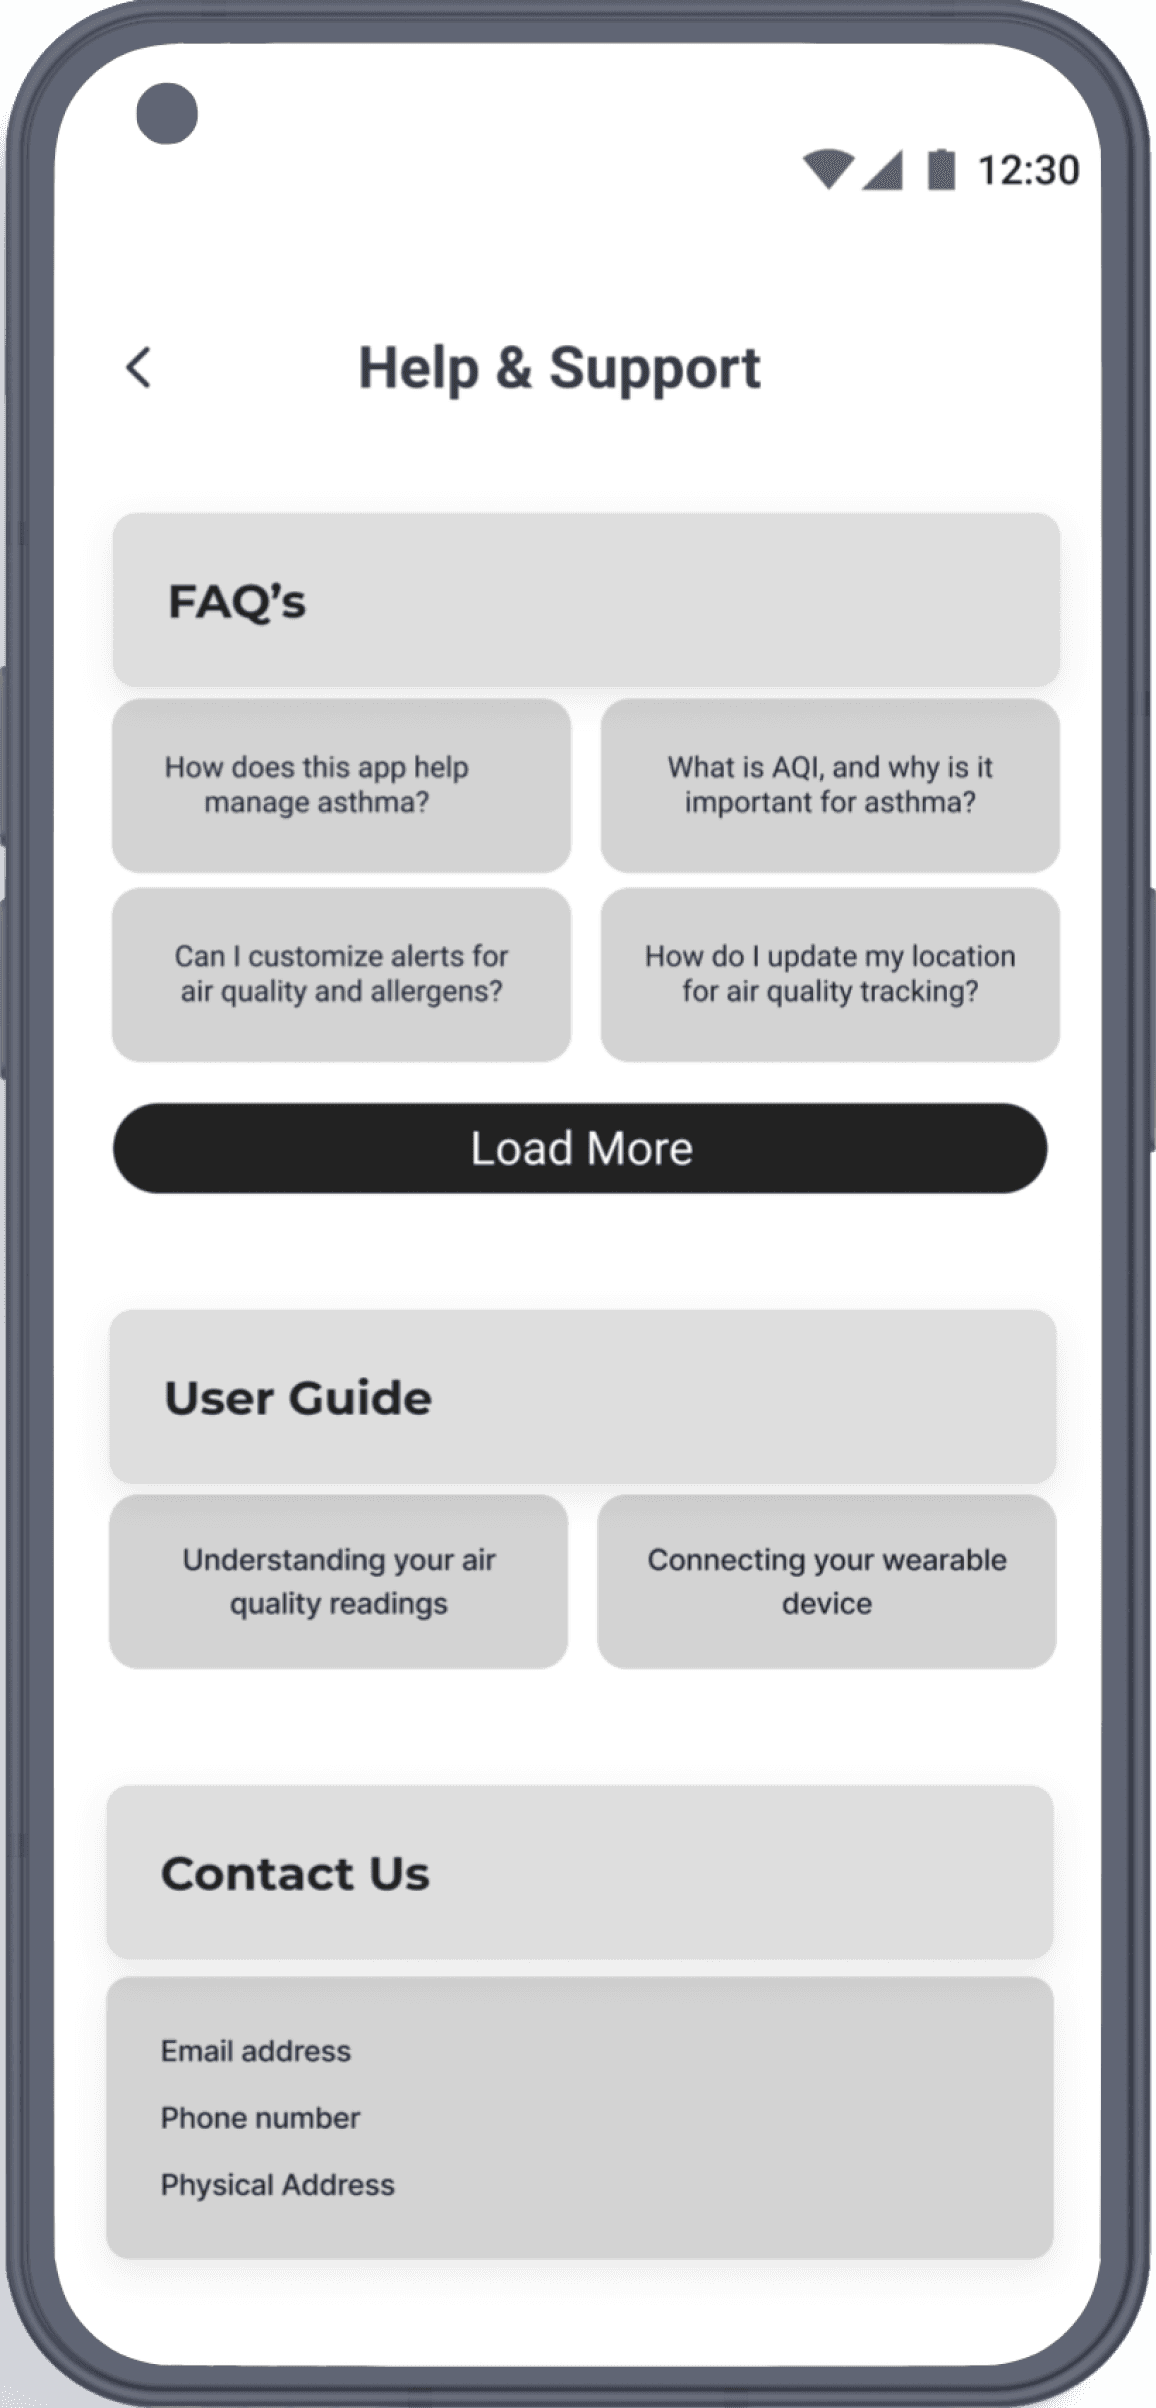
Site Map
Site Map
Define
Key Findings
Users struggle to find and interpret real-time air quality data in a way that helps them take action.
People with asthma, allergies, or respiratory concerns need a more accessible and user-friendly solution.
Clear, personalized warnings and recommendations are essential for managing air quality risks effectively.
Simplicity and ease of use are critical for adoption and daily engagement.
Site Map
Define
The User
The User
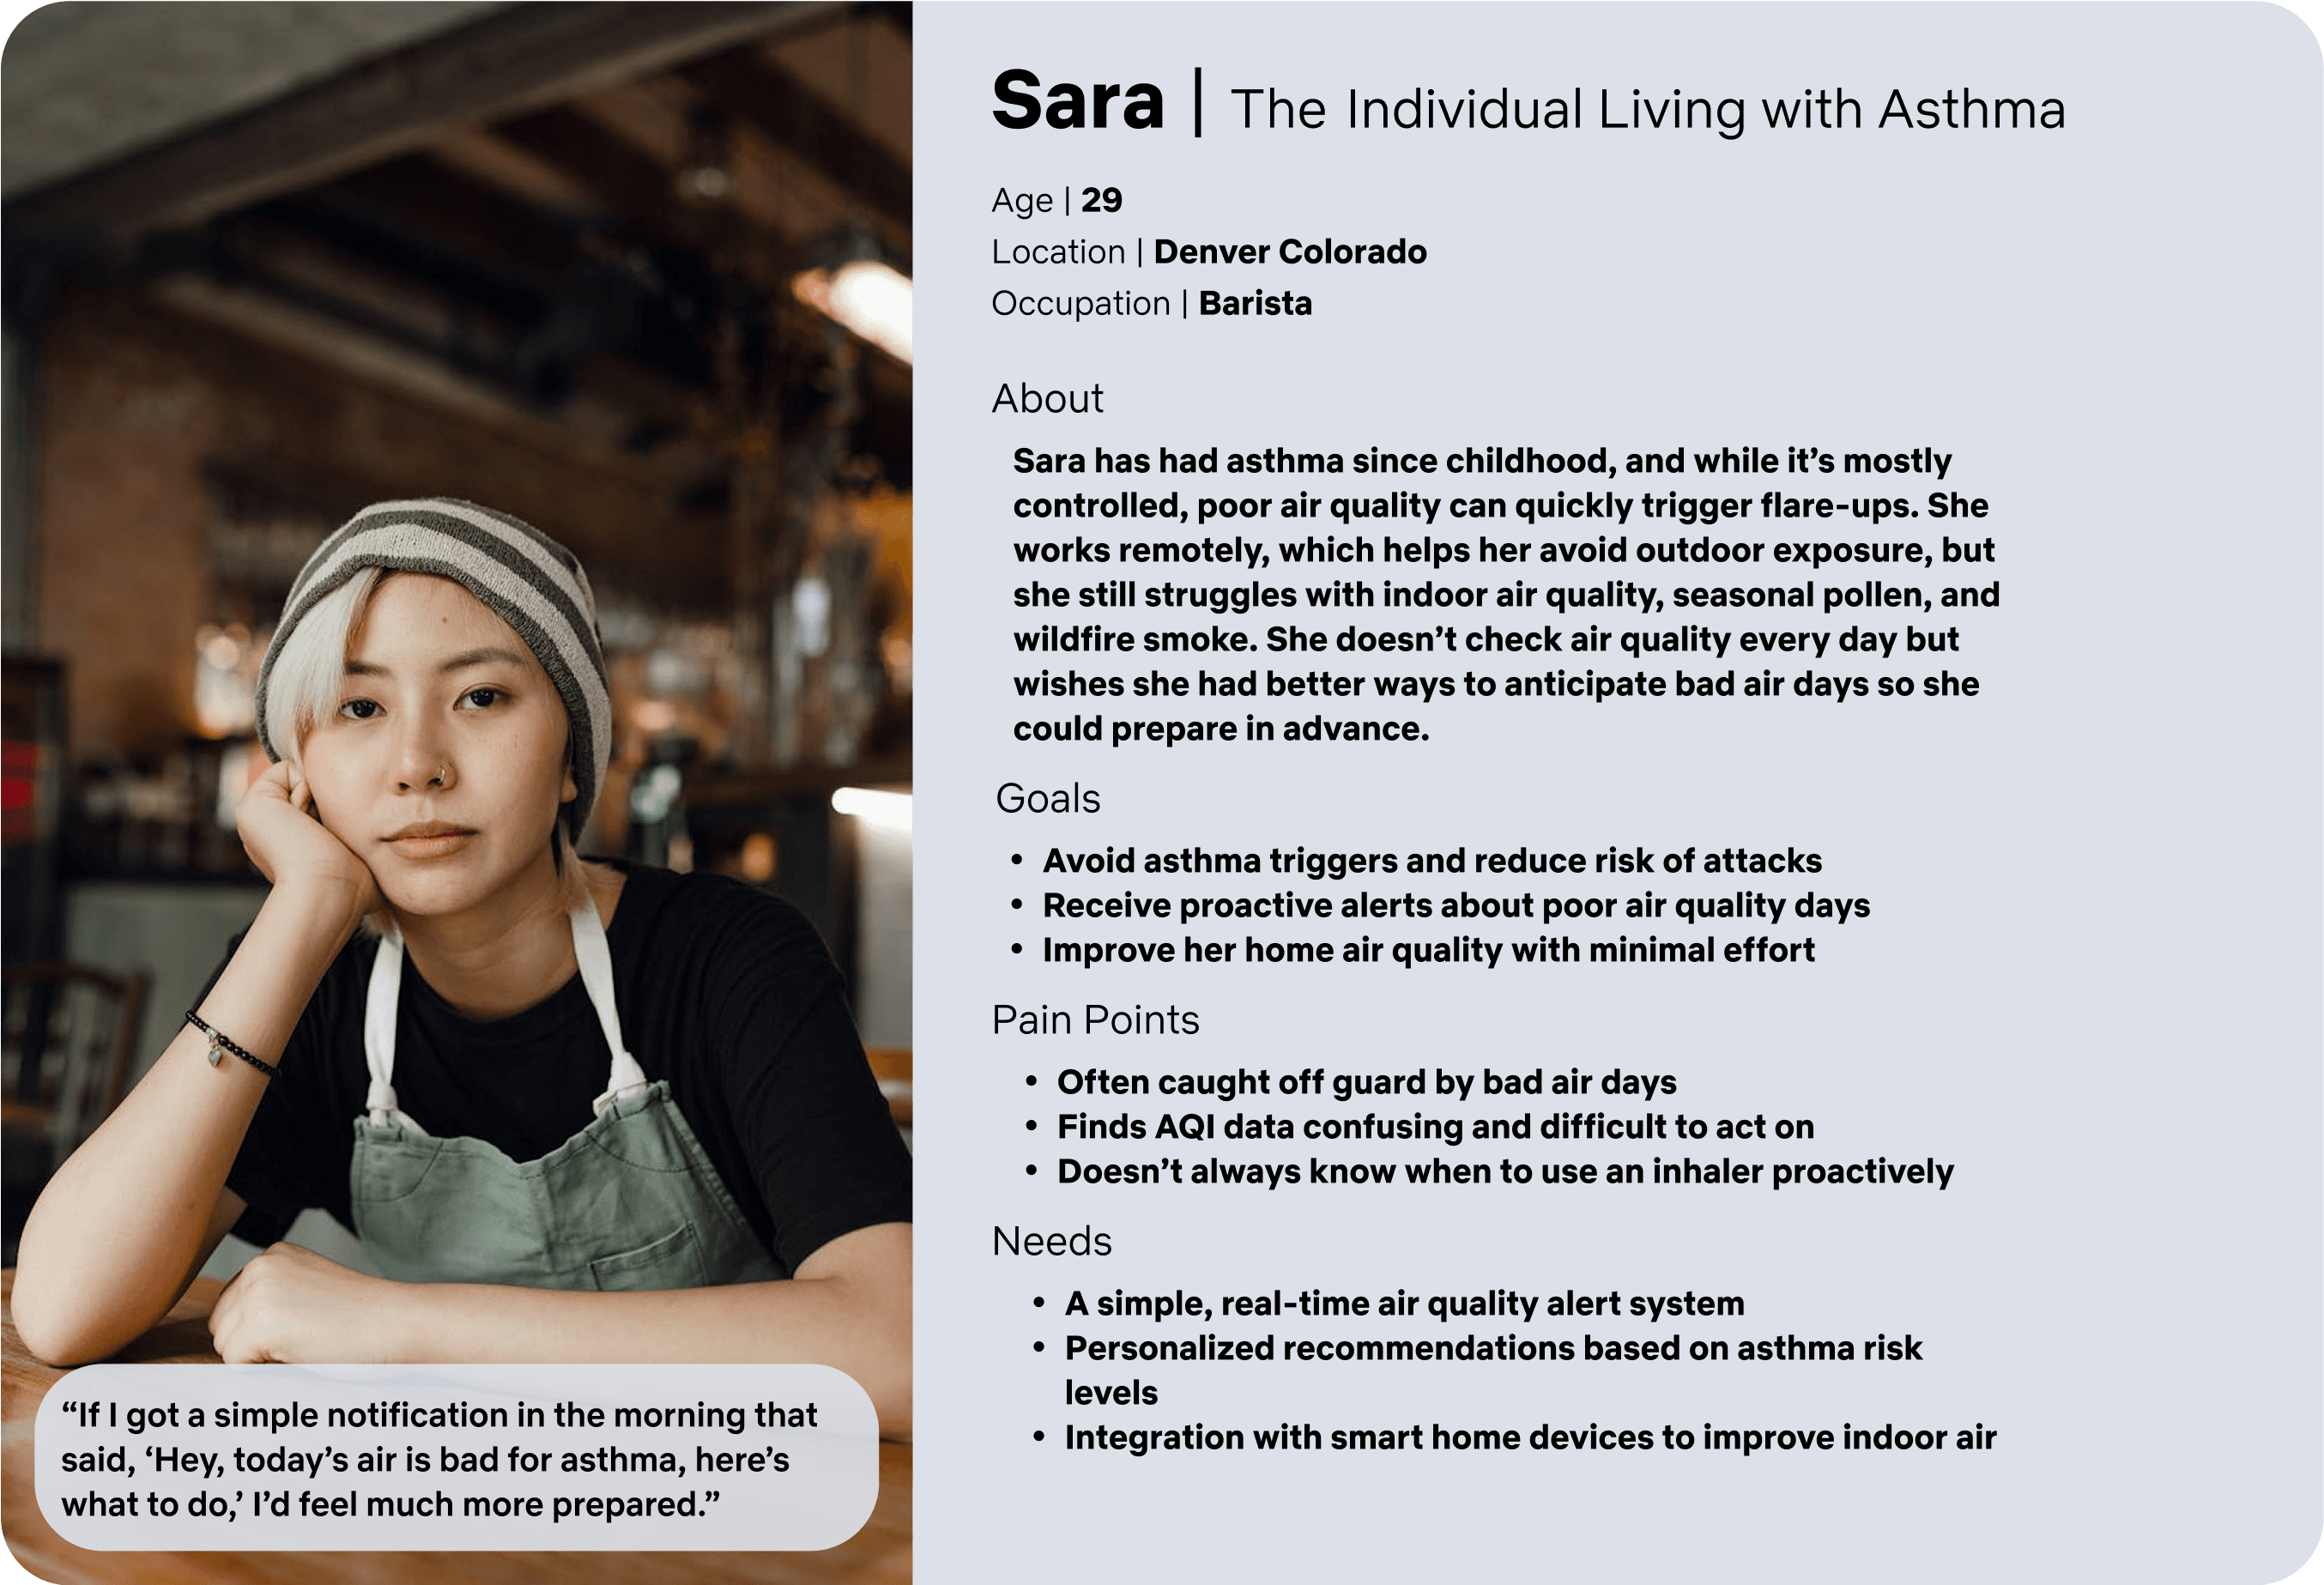
Bridging Business Goals with User Needs
Bridging Business Goals with User Needs
The goal was to empower users—especially families with asthma—to track air quality and respond effectively. I used “How Might We” framing to connect health-related anxiety with data clarity, real-time alerts, and family-friendly features. The design process remained focused on translating complex air quality metrics into simple, supportive tools for better daily decisions and user confidence.
How Might We
How Might We
…provide air quality-conscious users with real-time and forecasted air quality data to help them minimize pollutant exposure and maintain their health?
...deliver real-time air quality alerts to outdoor workers so they can take immediate action to protect their respiratory health in fluctuating conditions?
…enable caregivers to monitor air quality and symptom trends for their loved ones to proactively manage asthma risks and ensure their family’s safety?
Design
Wireframing
Wireframing


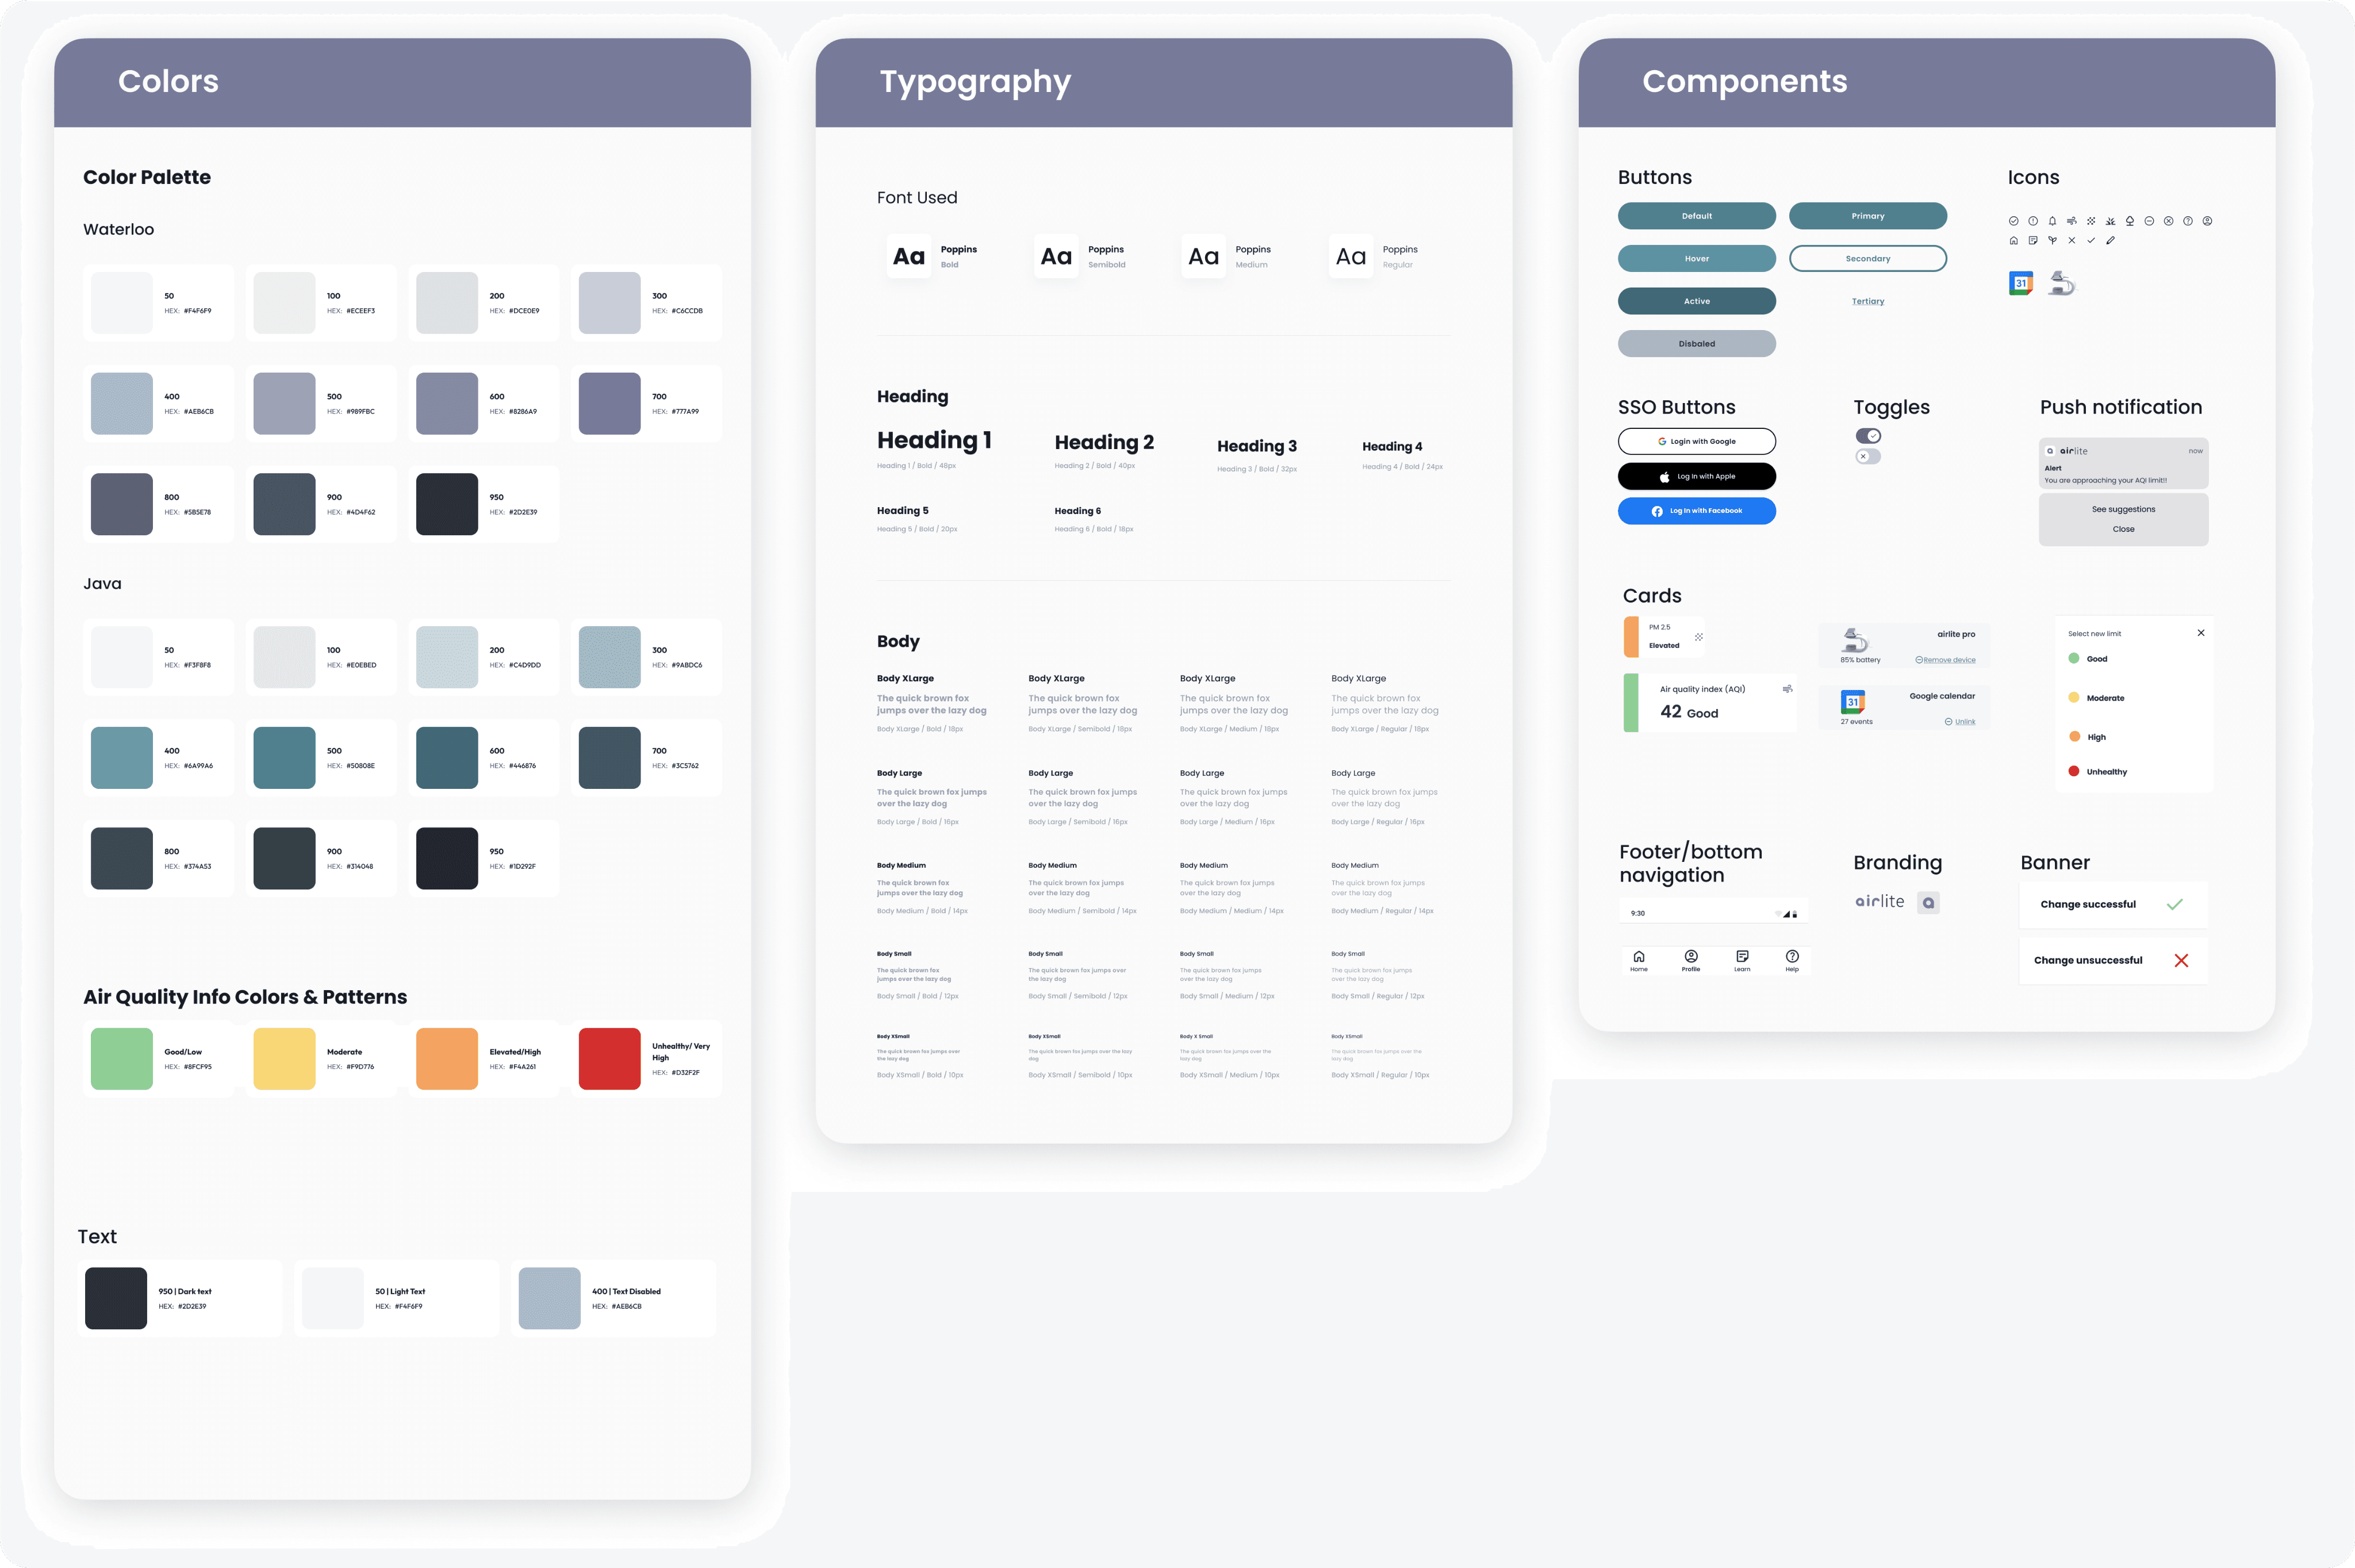
Branding | UI Kit
Branding | UI Kit
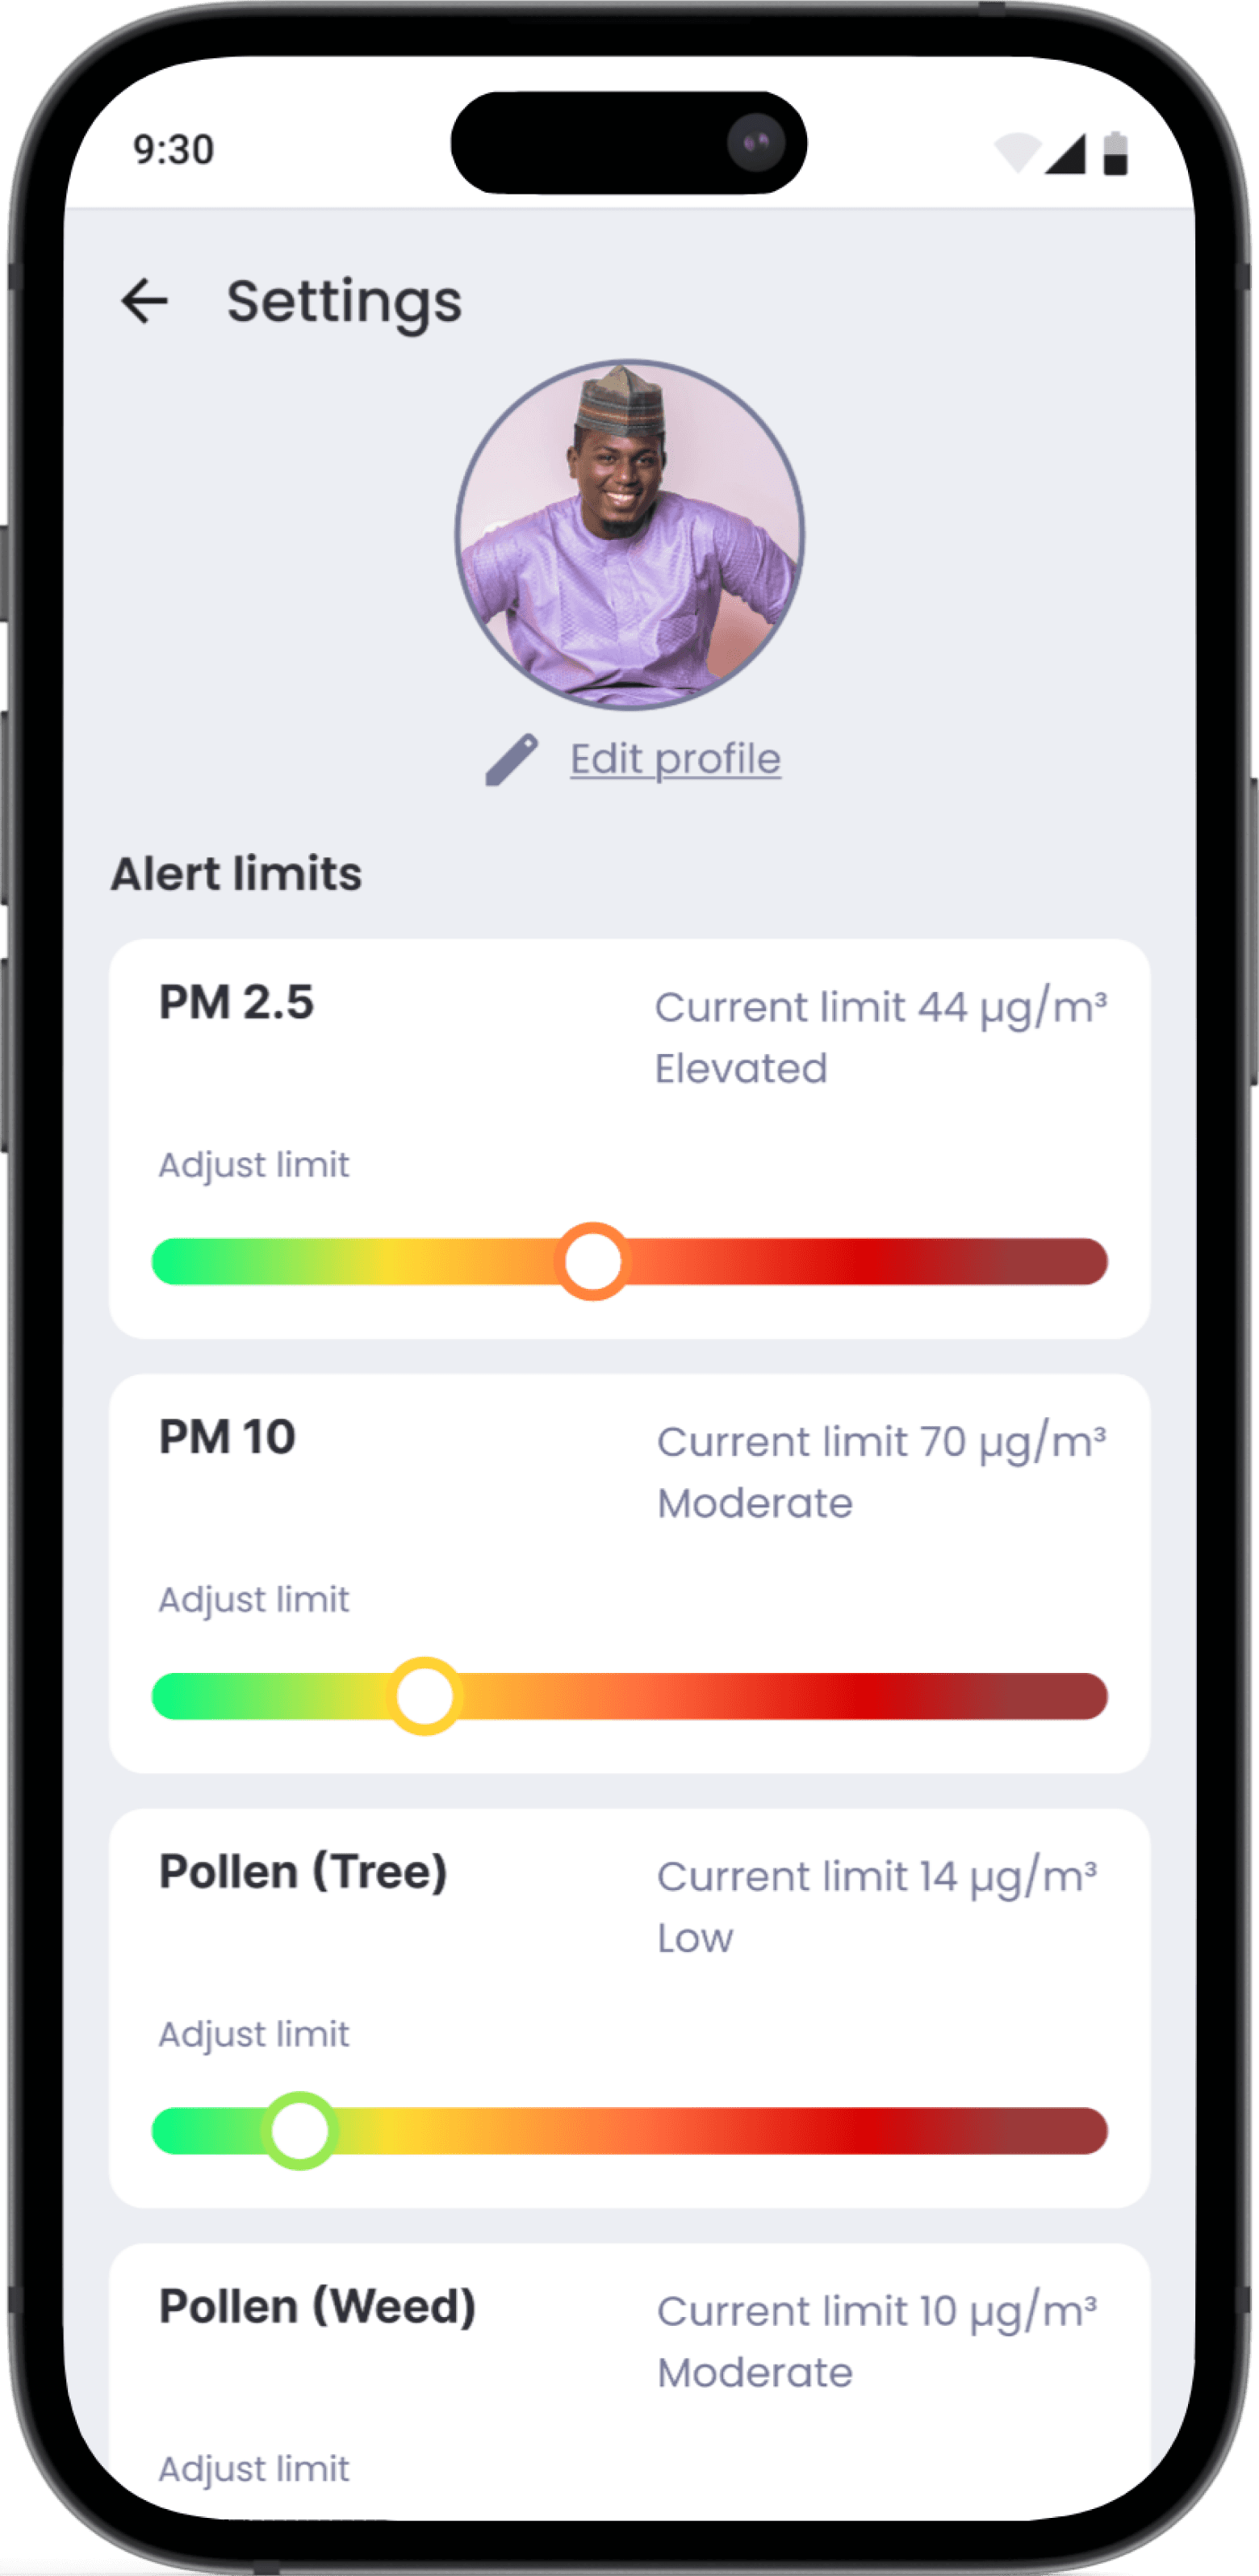
The interactive slider for choosing air quality levels is easy to use, but it feels overly sensitive and doesn't clearly show the selected value.
– Participant from Ukraine
The AQI scale looks good, but it's very similar to the adjustable scale on the settings page.
– Participant from Seattle
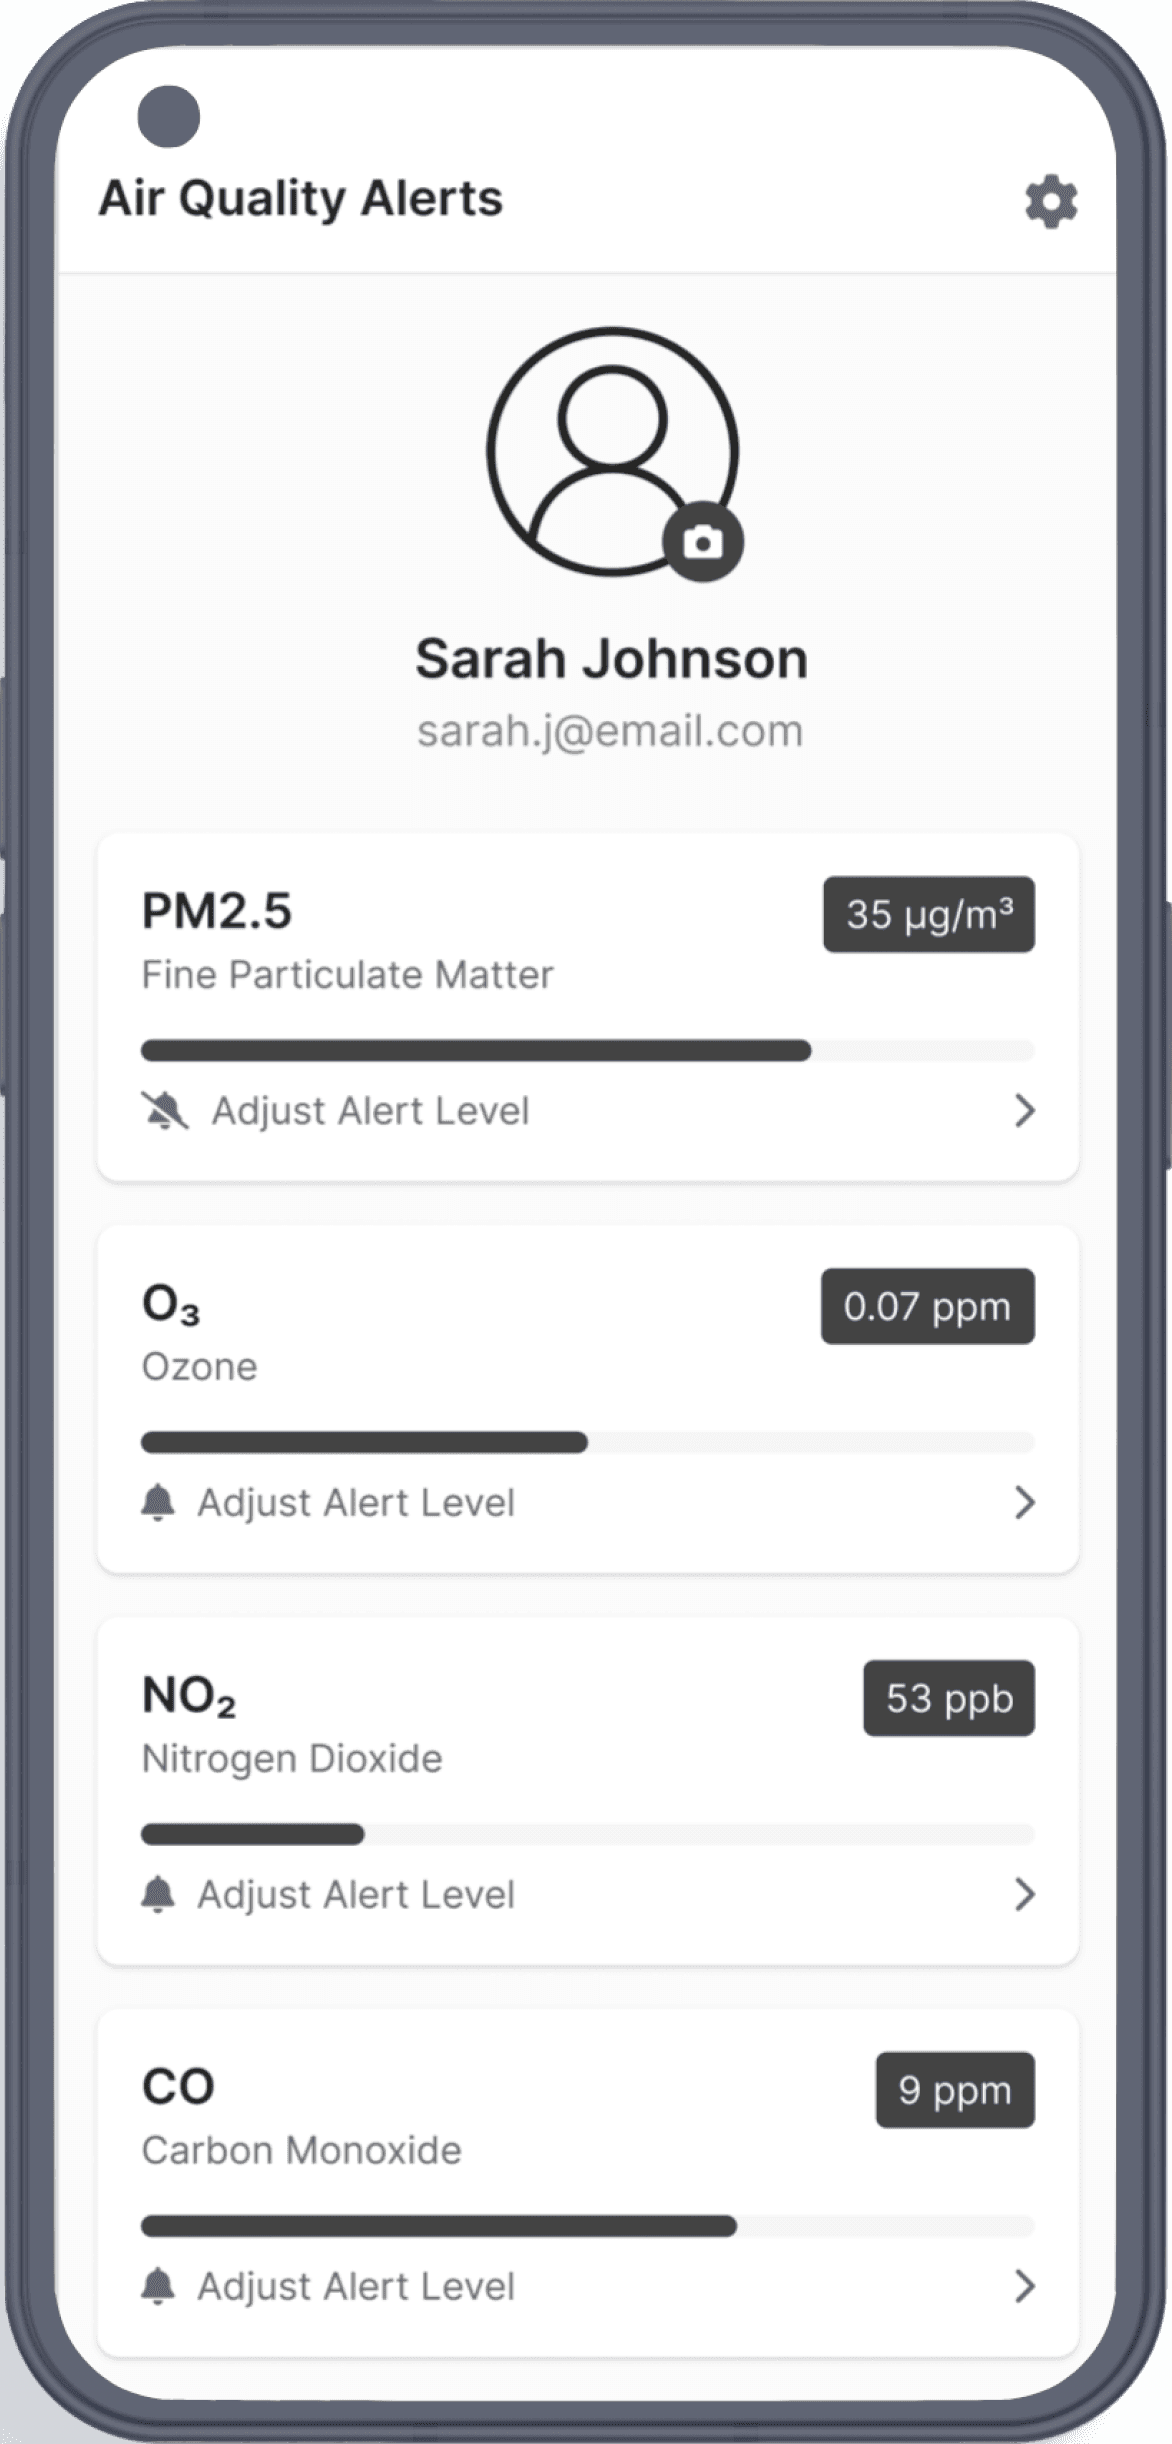
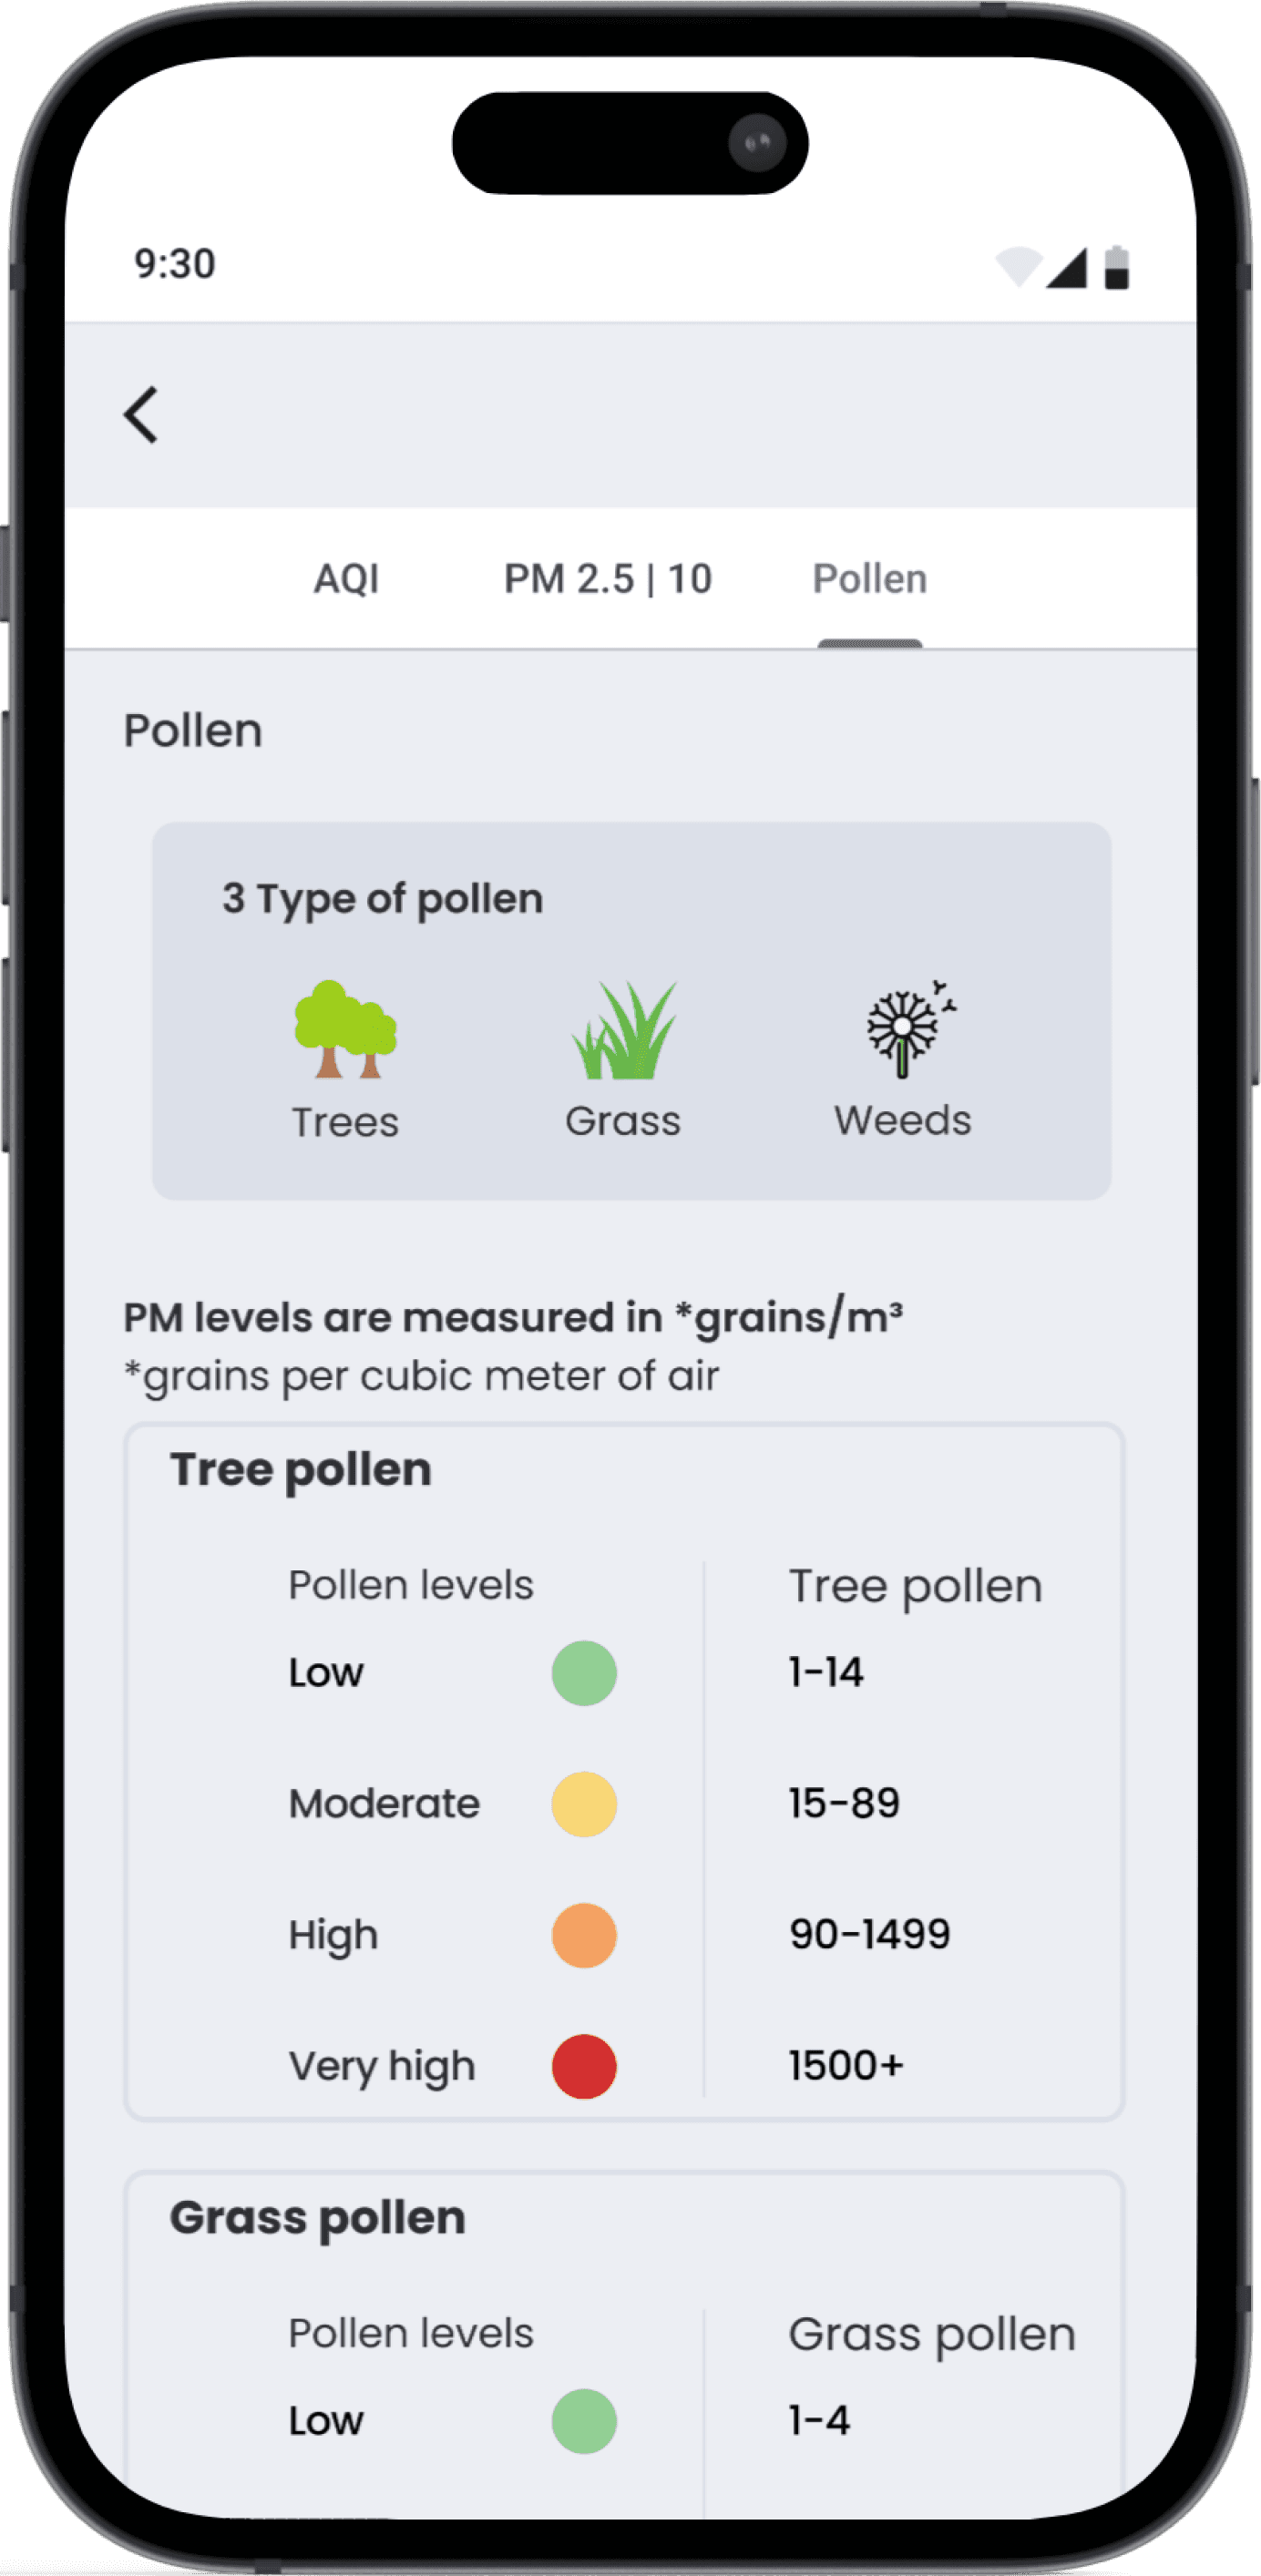
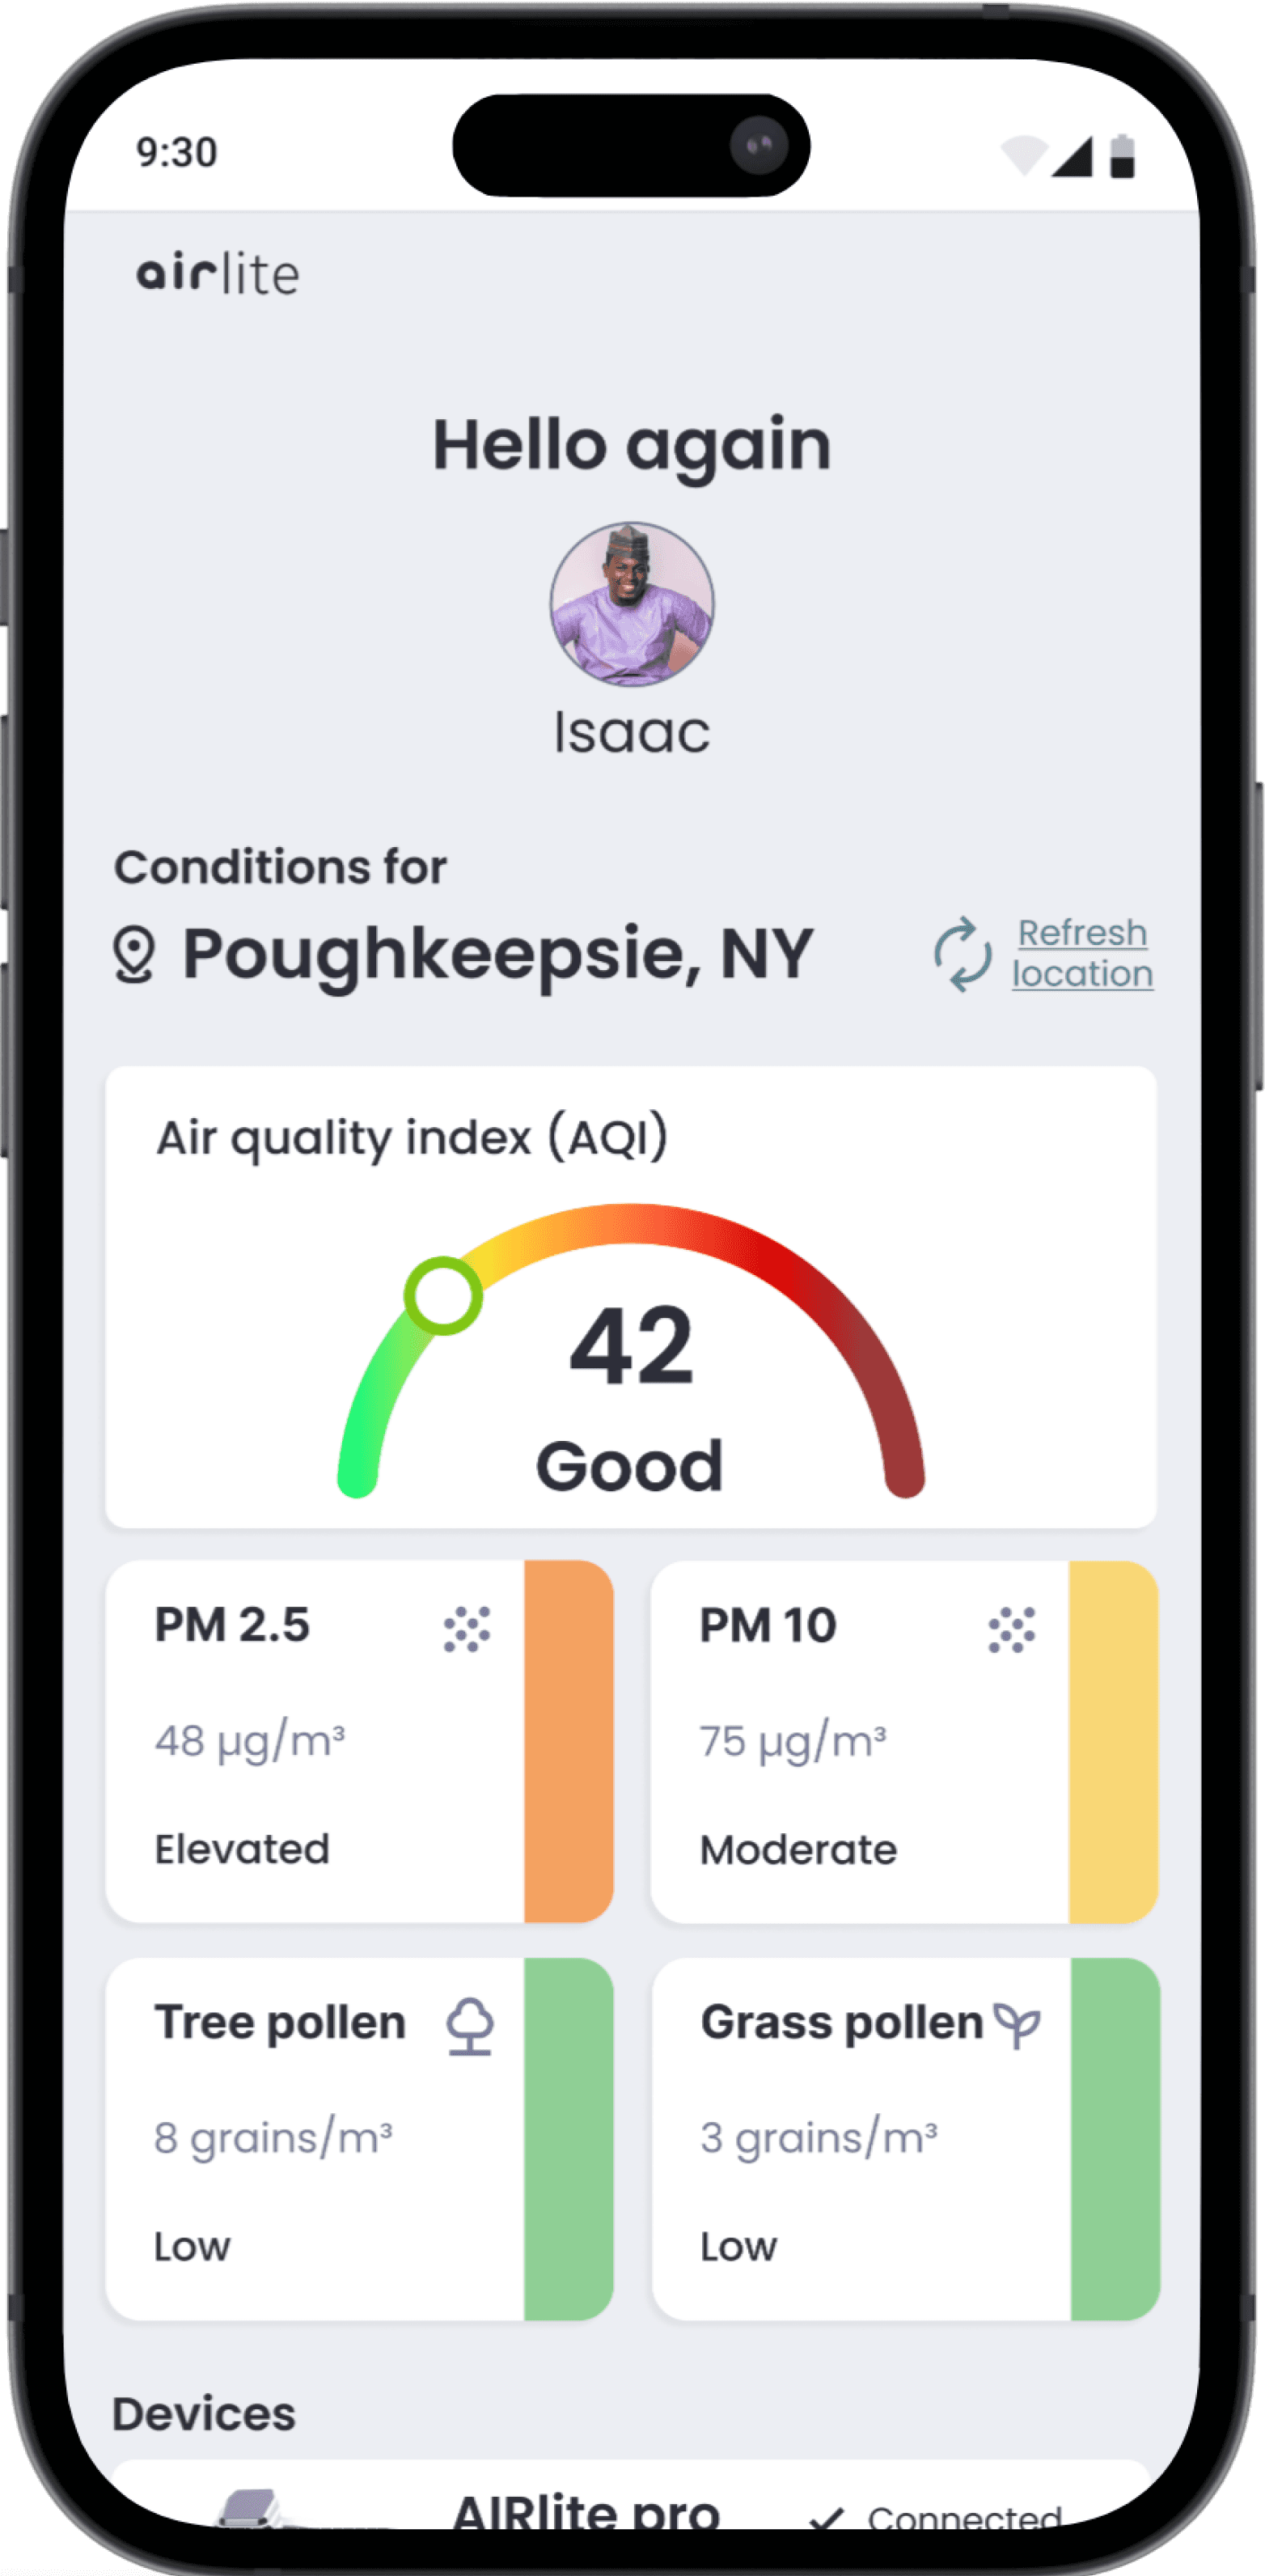
In the pollutant cards on the dashboard, I really just want to quickly see if the air quality is good or bad. Simplifying this information into clear status indicators would help me understand the air quality at a glance.
– Participant from New York
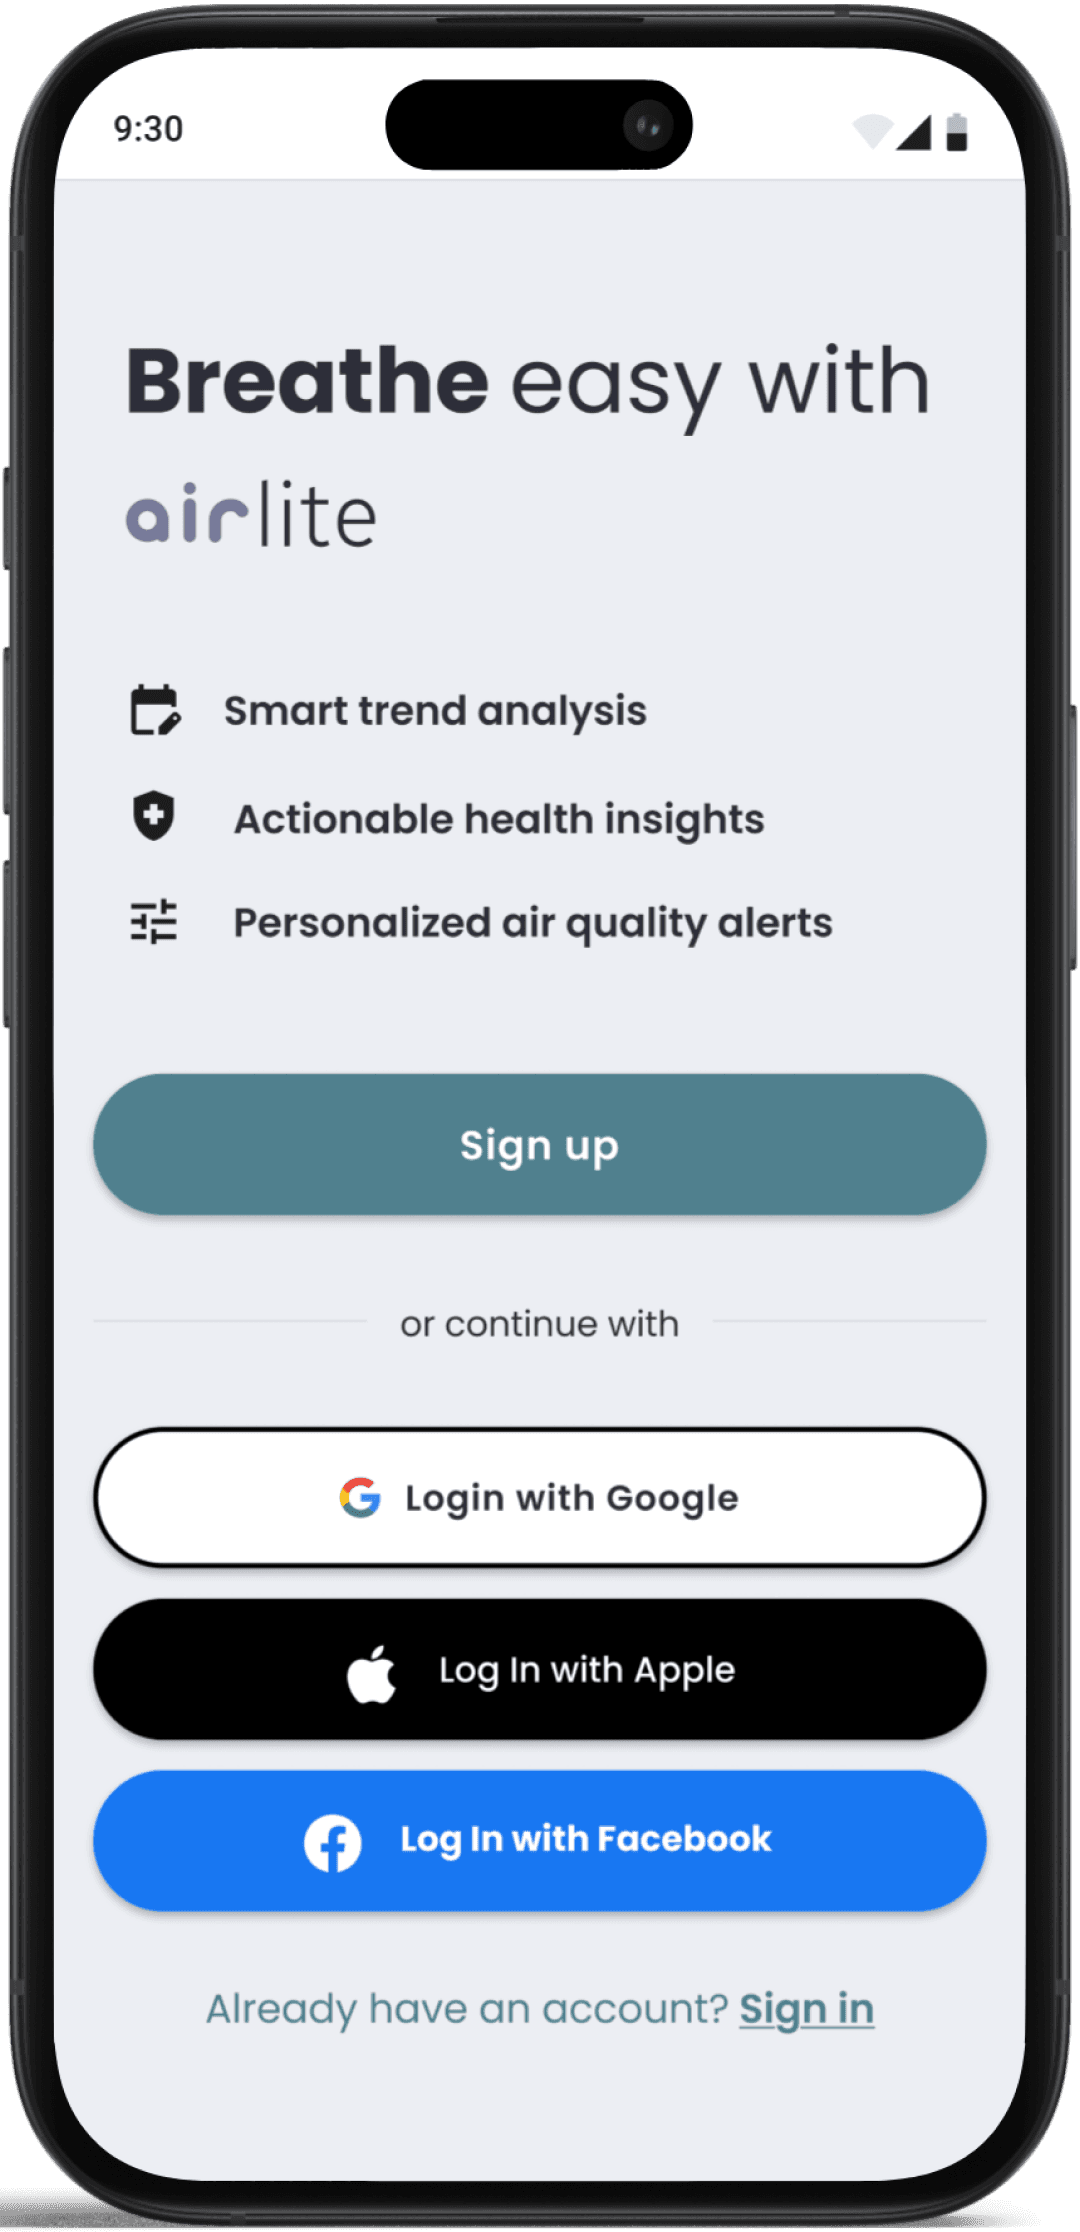
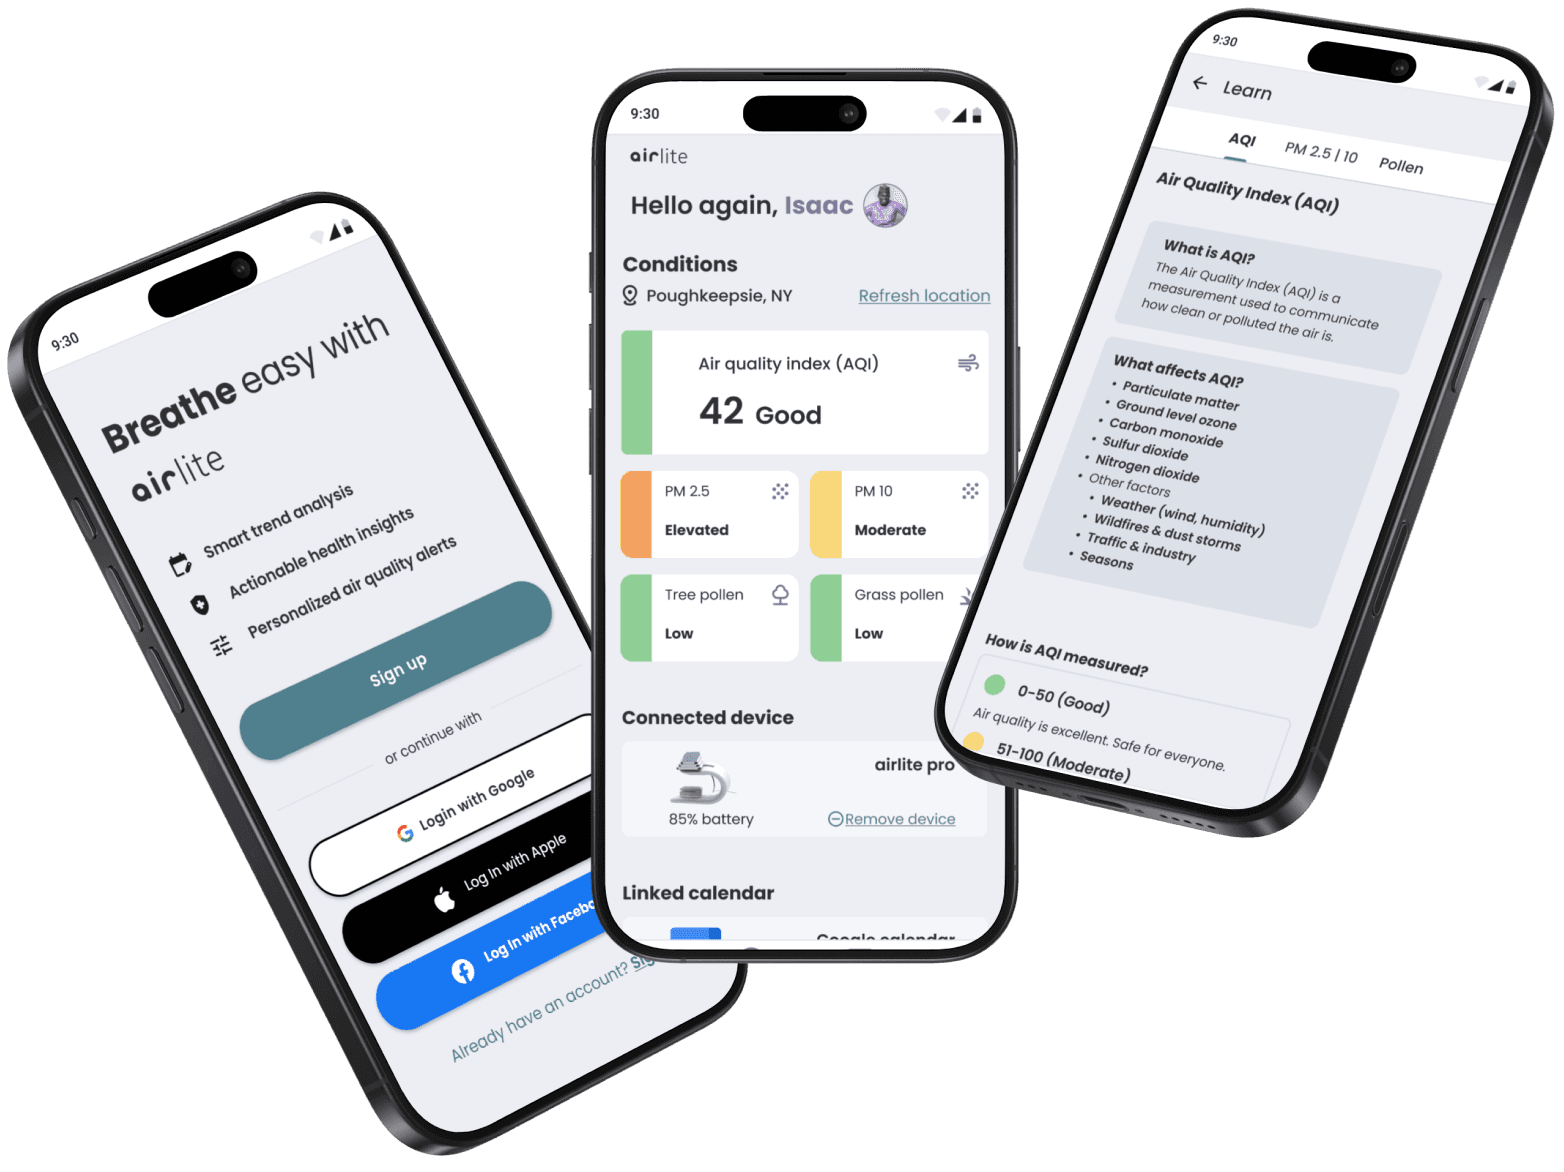
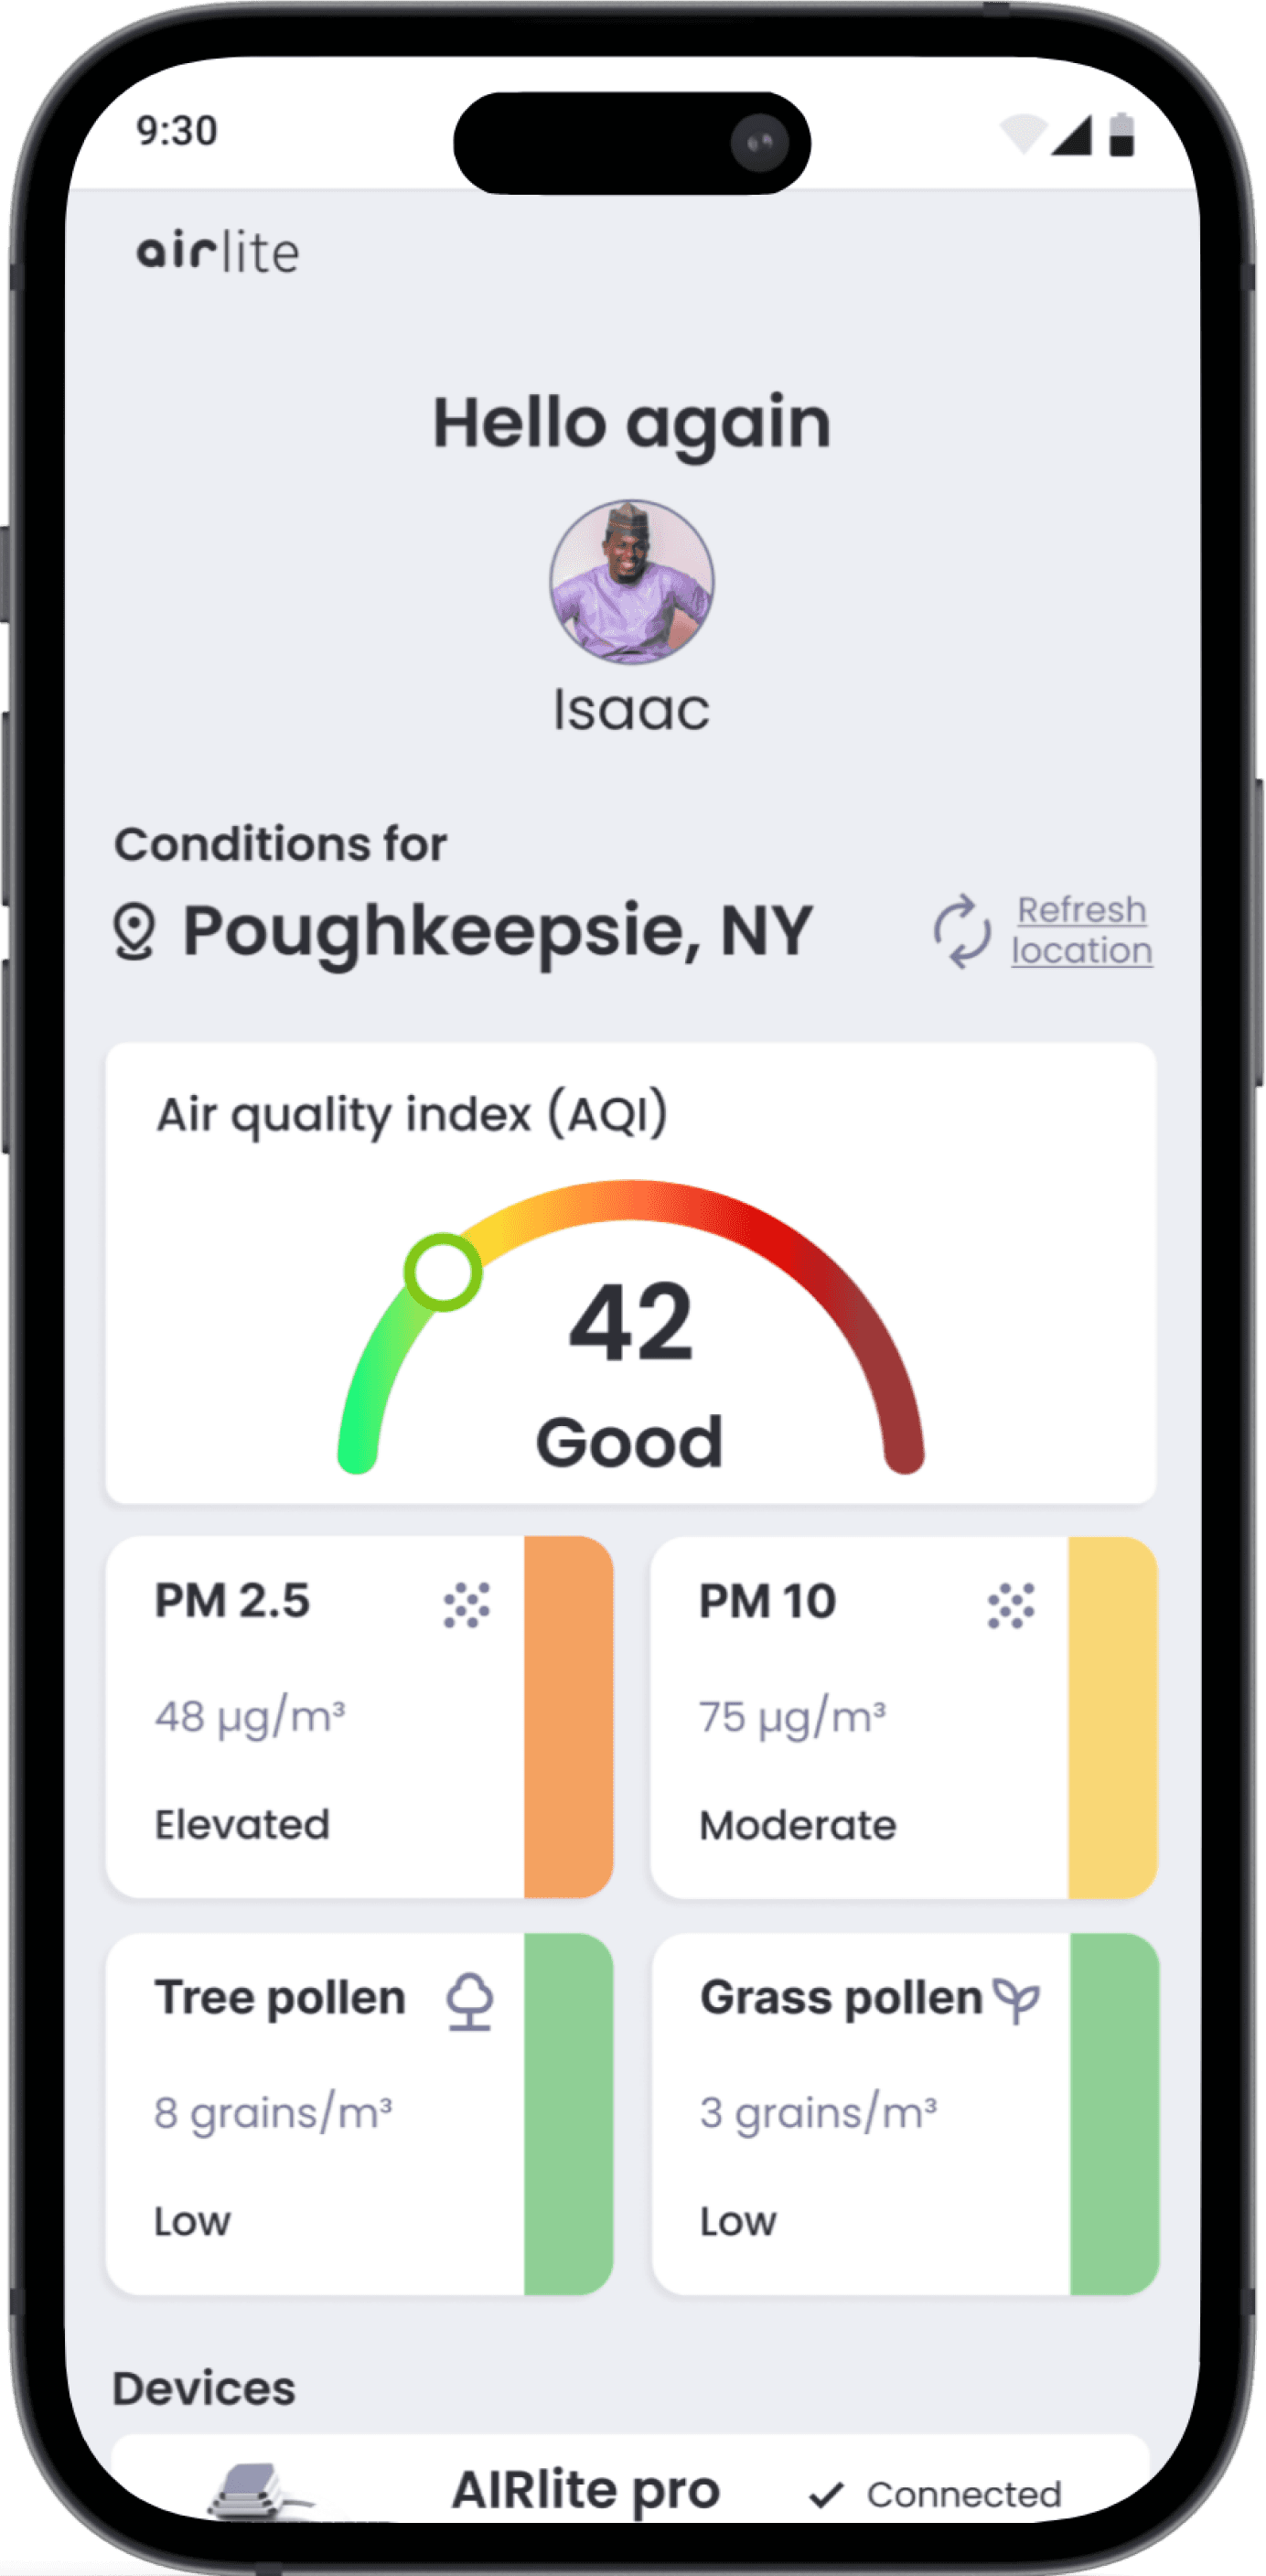
High Fidelity Designs
High Fidelity Designs


Test
Usability Feedback
Usability Feedback
The interactive slider for choosing air quality levels is easy to use, but it feels overly sensitive and doesn't clearly show the selected value.
– Participant from Ukraine
The AQI scale looks good, but it's very similar to the adjustable scale on the settings page.
– Participant from Seattle
In the pollutant cards on the dashboard, I really just want to quickly see if the air quality is good or bad. Simplifying this information into clear status indicators would help me understand the air quality at a glance.
– Participant from New York
before
after
1
2
3
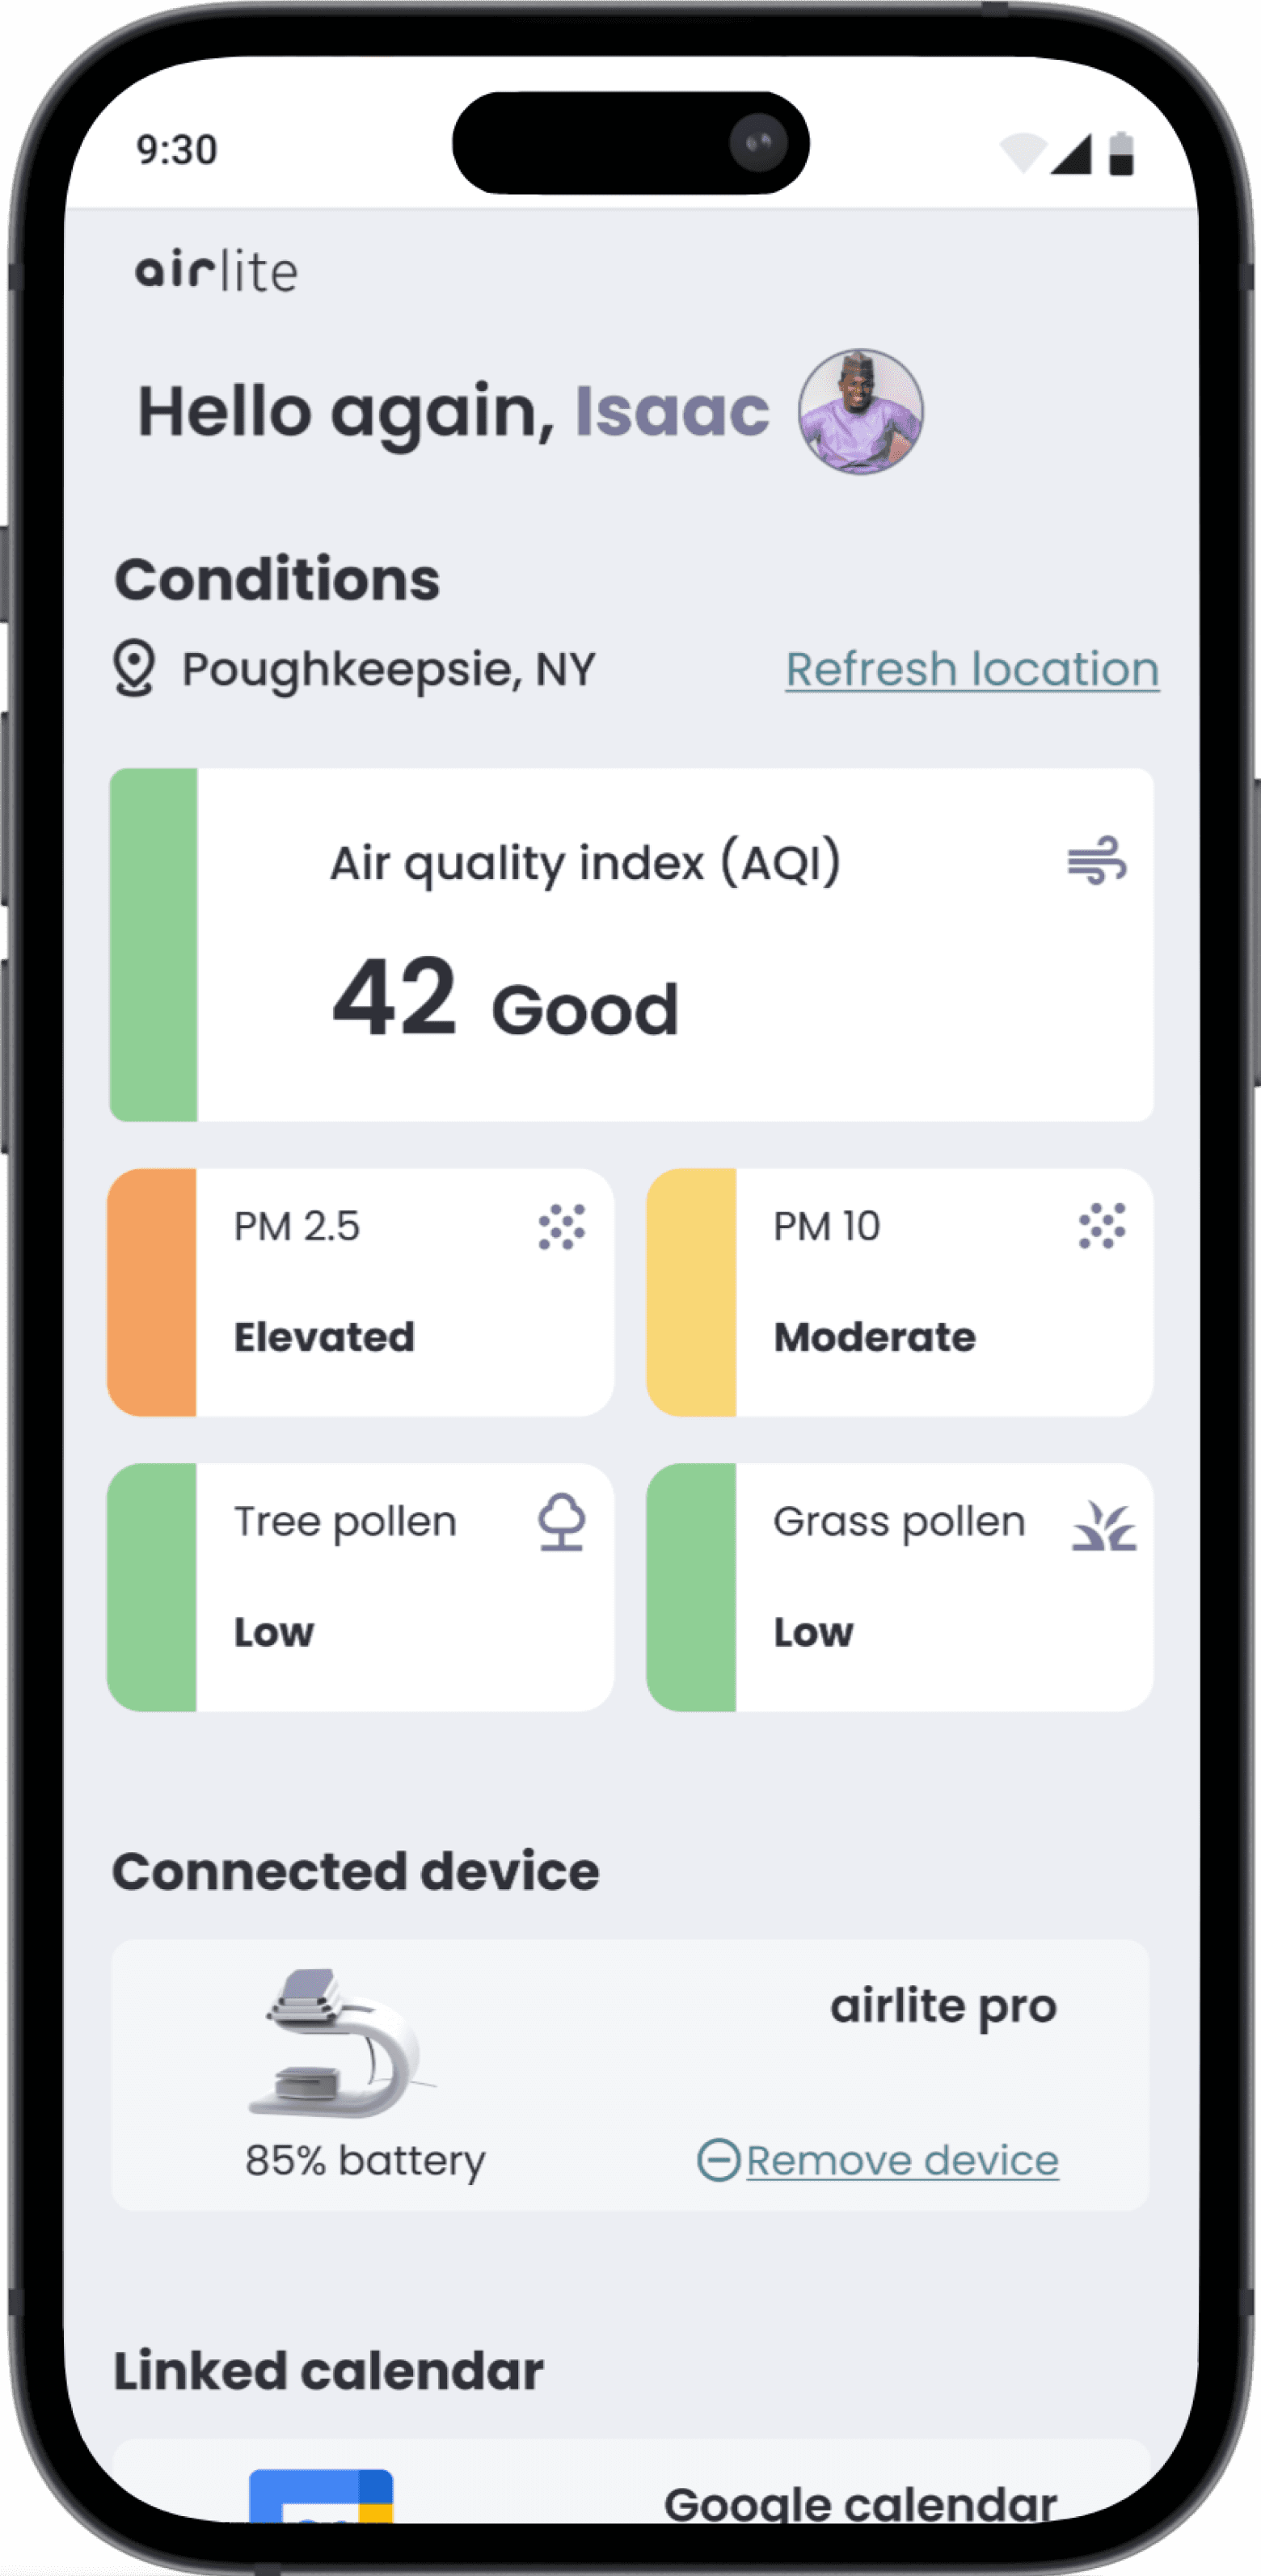
Restructured user information to prioritize main content.
Established a consistent color scale across all pollutant categories for improved clarity and usability.
Removed excess card detail for improved readability and quicker scanning.
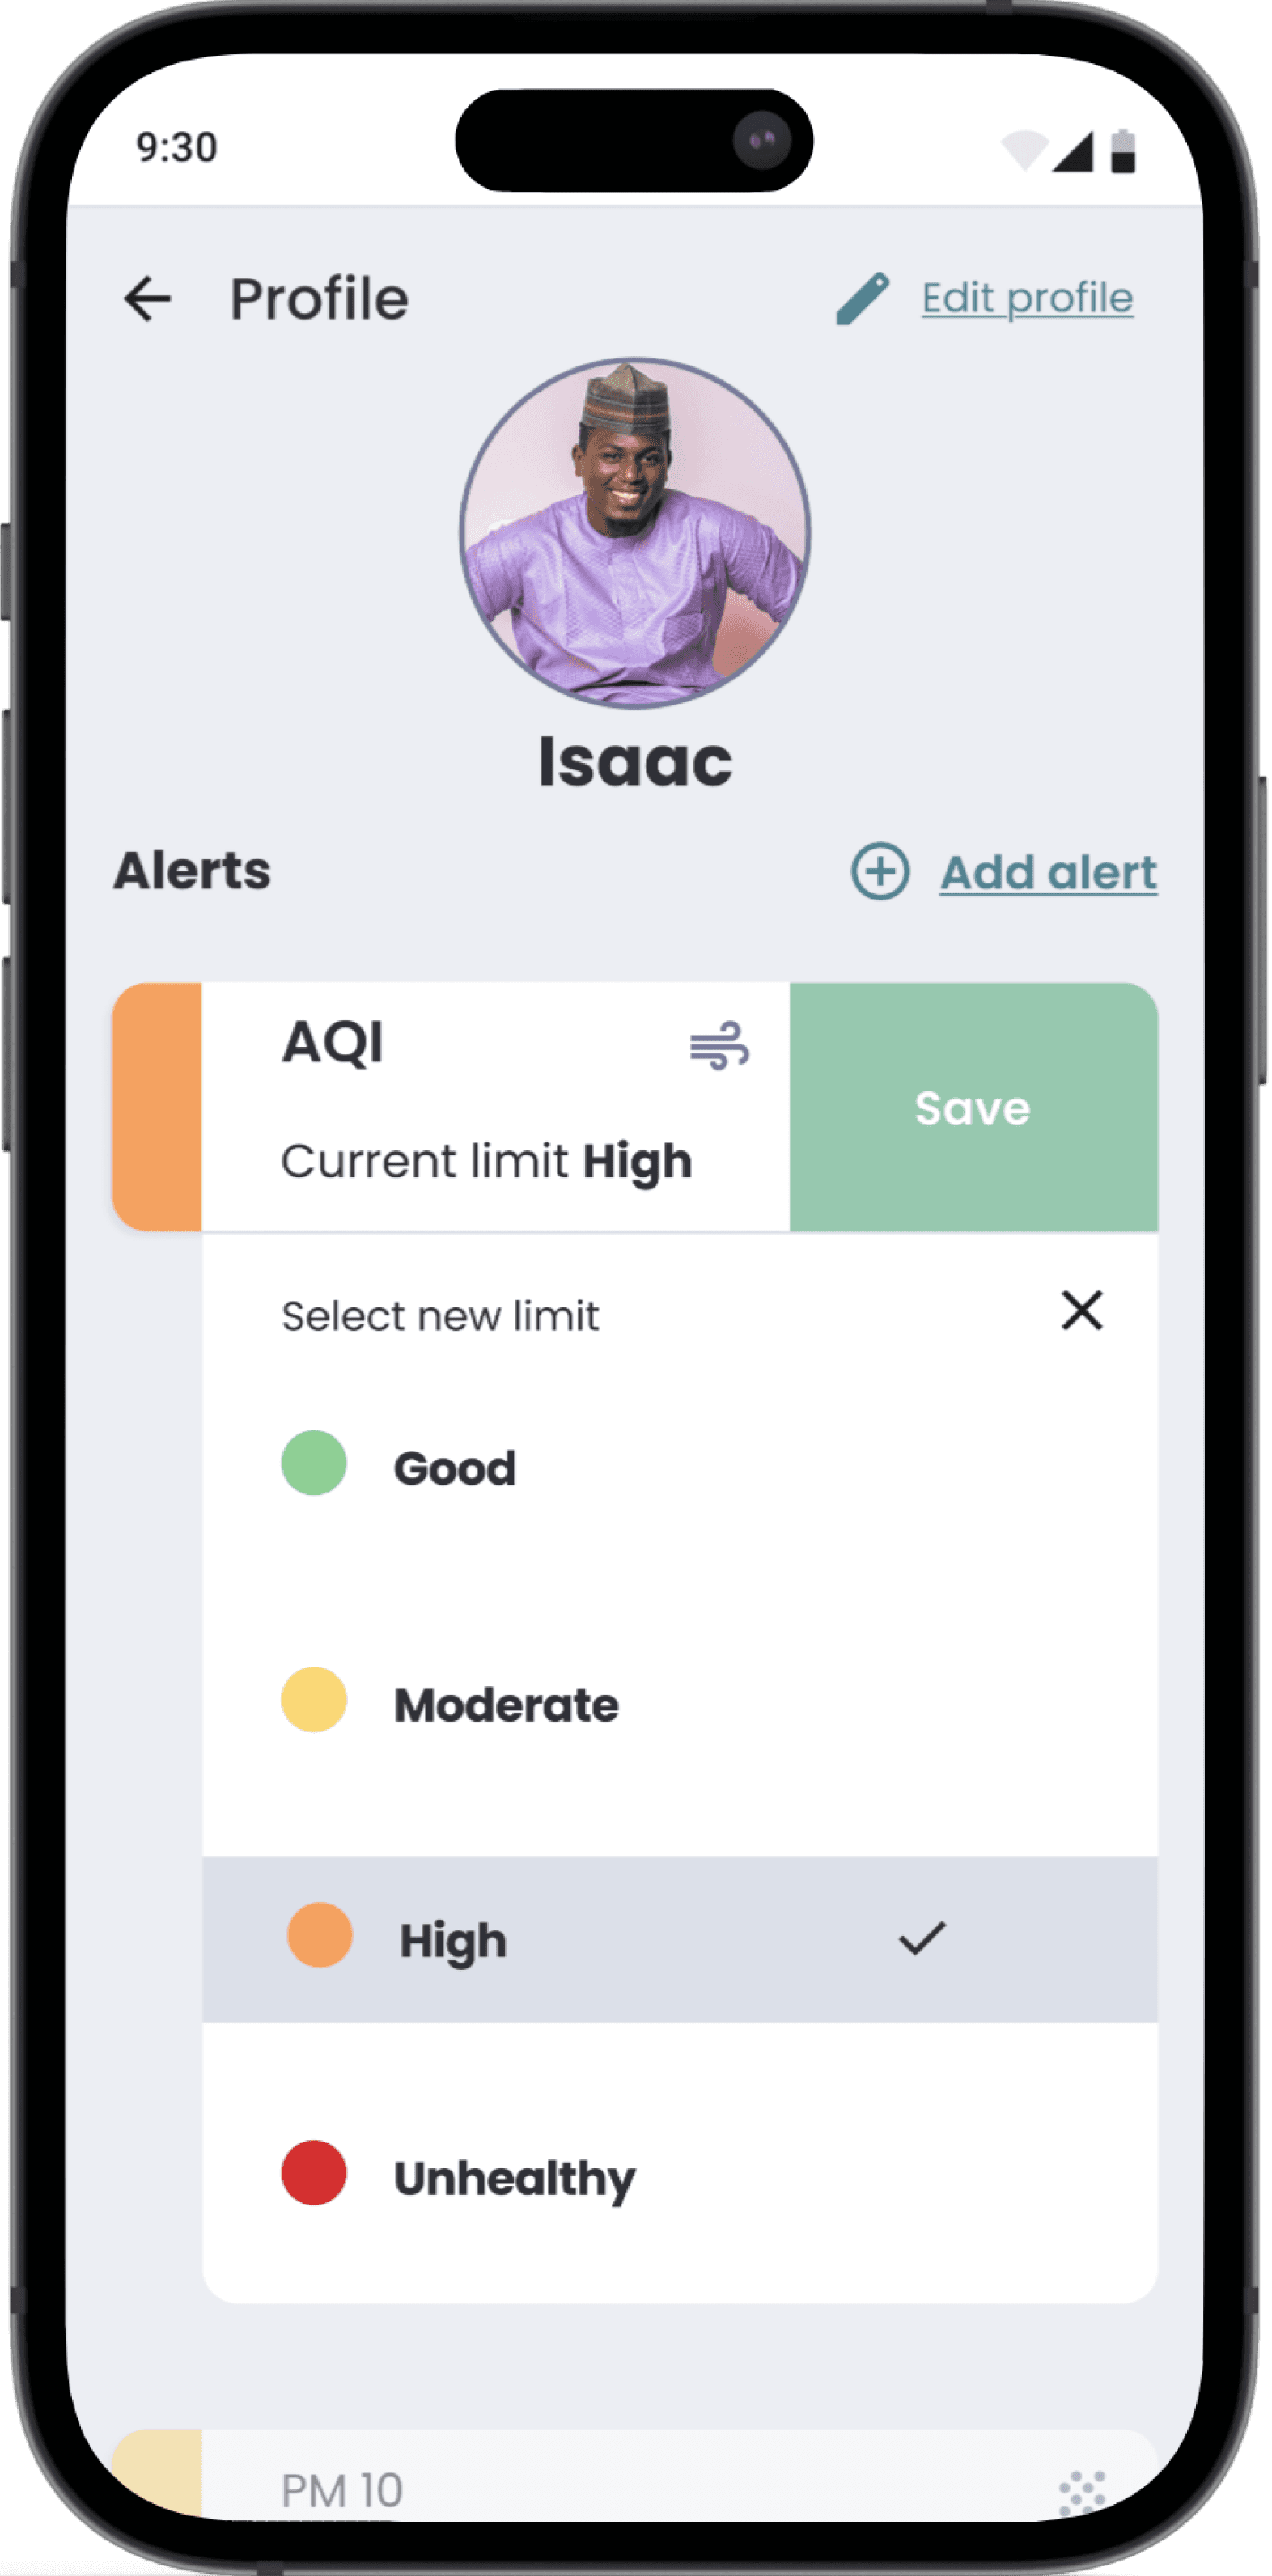
Iterate
1
2
3
Refined pollutants limit scale for better intuitiveness.
Eliminated ambiguous color coding for improved clarity.
Simplified categories to Good, Moderate, High, & Unhealthy
before
after
After completing the initial round of high-fidelity mockup testing, adjustments were made to enhance usability and reduce confusion:
After completing the initial round of high-fidelity mockup testing, adjustments were made to enhance usability and reduce confusion.
1
2
3
Restructured user information to prioritize main content.
Established a consistent color scale across all pollutant categories for improved clarity and usability.
Removed excess card detail for improved readability and quicker scanning.
before
after
1
2
3
Restructured user information to prioritize main content.
Established a consistent color scale across all pollutant categories for improved clarity and usability.
Removed excess card detail for improved readability and quicker scanning.
1
2
3
Refined pollutants limit scale for better intuitiveness.
Eliminated ambiguous color coding for improved clarity.
Simplified categories to Good, Moderate, High, & Unhealthy
before
after
1
2
3
Refined pollutants limit scale for better intuitiveness.
Eliminated ambiguous color coding for improved clarity.
Simplified categories to Good, Moderate, High, & Unhealthy
Solution
Airlite App helps individuals with asthma and air quality concerns stay ahead of symptoms with real-time insights, personalized alerts, and customizable thresholds for pollen and air quality. With intuitive navigation and clear resources, it empowers users to make informed decisions and manage their respiratory health proactively.